

Calcium buffering in rodent olfactory bulb granule cells and mitral cells
- PMID: 19635818
- PMCID: PMC2766651
- DOI: 10.1113/jphysiol.2009.174540
Calcium buffering in rodent olfactory bulb granule cells and mitral cells
Abstract
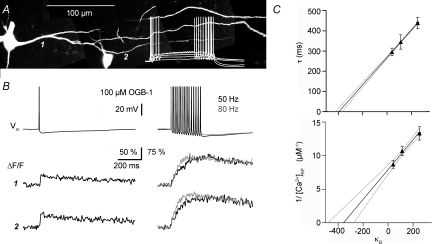
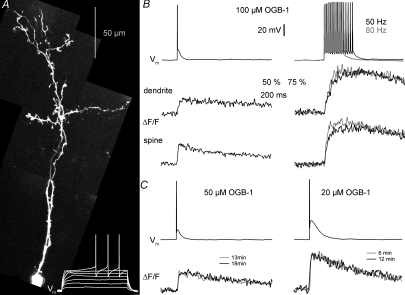
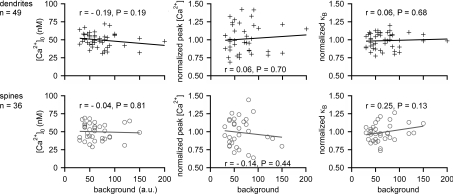
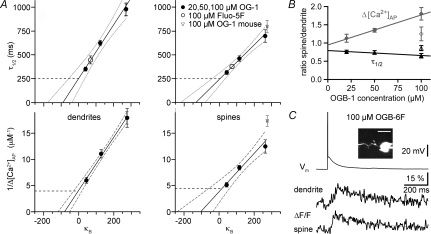
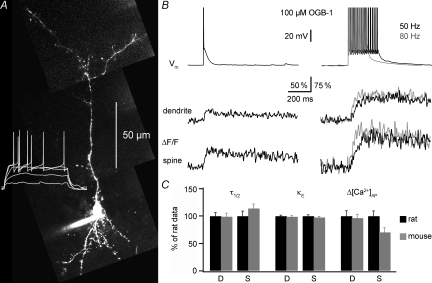
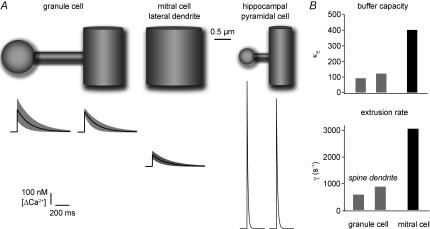
In the mammalian olfactory bulb, axonless granule cells (GCs) mediate self- and lateral inhibitory interactions between mitral cells (MCs) via reciprocal dendrodendritic synapses. Calcium signals in the GC dendrites and reciprocal spines appear to decay unusually slowly, hence GC calcium handling might contribute to the known asynchronous release at this synapse. By recording fluorescence transients of different Ca(2+)-sensitive dyes at variable concentrations evoked by backpropagating action potentials (APs) and saturating AP trains we extrapolated Ca(2+) dynamics to conditions of zero added buffer for juvenile rat GC apical dendrites and spines and MC lateral dendrites. Resting [Ca(2+)] was at approximately 50 nM in both GC dendrites and spines. The average endogenous GC buffer capacities (kappa(E)) were within a range of 80-90 in the dendrites and 110-140 in the spines. The extrusion rate (gamma) was estimated as 570 s(-1) for dendrites and 870 s(-1) for spines and the decay time constant as approximately 200 ms for both. Single-current-evoked APs resulted in a [Ca(2+)] elevation of approximately 250 nM. Calcium handling in juvenile and adult mouse GCs appeared mostly similar. In MC lateral dendrites, we found AP-mediated [Ca(2+)] elevations of approximately 130 nM with a similar decay to that in GC dendrites, while kappa(E) and gamma were roughly 4-fold higher. In conclusion, the slow GC Ca(2+) dynamics are due mostly to sluggish Ca(2+) extrusion. Under physiological conditions this slow removal may well contribute to delayed release and also feed into other Ca(2+)-dependent mechanisms that foster asynchronous output from the reciprocal spine.
Figures
Similar articles
-
Two-Photon Na+ Imaging Reports Somatically Evoked Action Potentials in Rat Olfactory Bulb Mitral and Granule Cell Neurites.Front Cell Neurosci. 2017 Feb 28;11:50. doi: 10.3389/fncel.2017.00050. eCollection 2017. Front Cell Neurosci. 2017. PMID: 28293175 Free PMC article.
-
Coincidence Detection within the Excitable Rat Olfactory Bulb Granule Cell Spines.J Neurosci. 2019 Jan 23;39(4):584-595. doi: 10.1523/JNEUROSCI.1798-18.2018. J Neurosci. 2019. PMID: 30674614 Free PMC article.
-
Functional Specialization of Interneuron Dendrites: Identification of Action Potential Initiation Zone in Axonless Olfactory Bulb Granule Cells.J Neurosci. 2019 Dec 4;39(49):9674-9688. doi: 10.1523/JNEUROSCI.1763-19.2019. Epub 2019 Oct 29. J Neurosci. 2019. PMID: 31662426 Free PMC article.
-
Computing with dendrodendritic synapses in the olfactory bulb.Ann N Y Acad Sci. 2009 Jul;1170:264-9. doi: 10.1111/j.1749-6632.2009.03899.x. Ann N Y Acad Sci. 2009. PMID: 19686145 Review.
-
Models of calcium dynamics in cerebellar granule cells.Cerebellum. 2012 Mar;11(1):85-101. doi: 10.1007/s12311-010-0216-3. Cerebellum. 2012. PMID: 20922512 Review.
Cited by
-
Mechanisms and benefits of granule cell latency coding in the mouse olfactory bulb.Front Neural Circuits. 2012 Jun 27;6:40. doi: 10.3389/fncir.2012.00040. eCollection 2012. Front Neural Circuits. 2012. PMID: 22754503 Free PMC article.
-
Axonal sodium channel NaV1.2 drives granule cell dendritic GABA release and rapid odor discrimination.PLoS Biol. 2018 Aug 20;16(8):e2003816. doi: 10.1371/journal.pbio.2003816. eCollection 2018 Aug. PLoS Biol. 2018. PMID: 30125271 Free PMC article.
-
Two-Photon Na+ Imaging Reports Somatically Evoked Action Potentials in Rat Olfactory Bulb Mitral and Granule Cell Neurites.Front Cell Neurosci. 2017 Feb 28;11:50. doi: 10.3389/fncel.2017.00050. eCollection 2017. Front Cell Neurosci. 2017. PMID: 28293175 Free PMC article.
-
The fragile X mental retardation protein developmentally regulates the strength and fidelity of calcium signaling in Drosophila mushroom body neurons.Neurobiol Dis. 2011 Jan;41(1):147-59. doi: 10.1016/j.nbd.2010.09.002. Epub 2010 Sep 16. Neurobiol Dis. 2011. PMID: 20843478 Free PMC article.
-
Dendritic Arborization Patterns of Small Juxtaglomerular Cell Subtypes within the Rodent Olfactory Bulb.Front Neuroanat. 2017 Jan 20;10:127. doi: 10.3389/fnana.2016.00127. eCollection 2016. Front Neuroanat. 2017. PMID: 28163674 Free PMC article.
References
-
- Bayer SY. Neuron production in the hippocampus and olfactory bulb of the adult rat brain: addition or replacement? Ann N Y Acad Sci. 1985;457:163–172. - PubMed
-
- Brinon JG, Martinez-Guijarro FJ, Bravo IG, Arevalo R, Crespo C, Okazaki K, Hidaka H, Aijon J, Alonso JR. Coexpression of neurocalcin with other calcium-binding proteins in the rat main olfactory bulb. J Comp Neurol. 1999;407:404–414. - PubMed
Publication types
MeSH terms
Substances
LinkOut - more resources
Full Text Sources
Miscellaneous