. 2009 Oct;77(10):4643-53.
doi: 10.1128/IAI.01433-08. Epub 2009 Jul 27.

Antigen display, T-cell activation, and immune evasion during acute and chronic ehrlichiosis

Affiliations

Antigen display, T-cell activation, and immune evasion during acute and chronic ehrlichiosis

Bisweswar Nandi et al. Infect Immun. 2009 Oct.

Abstract

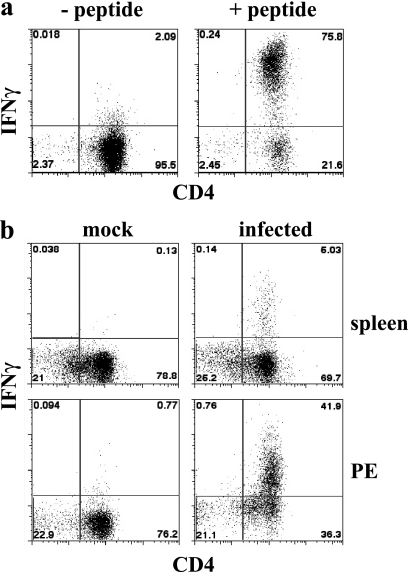
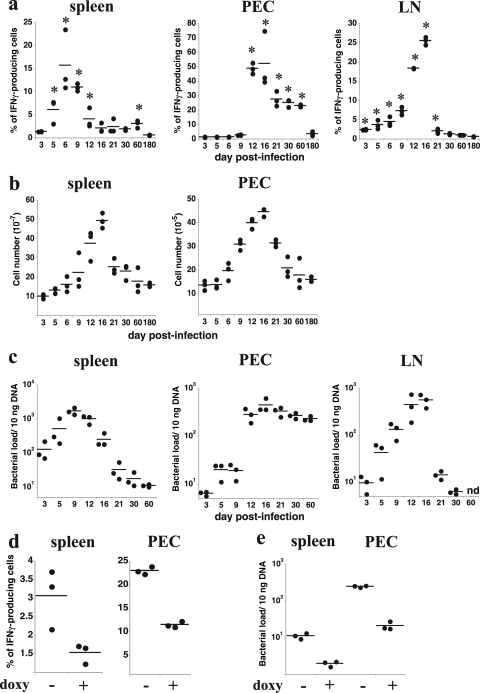
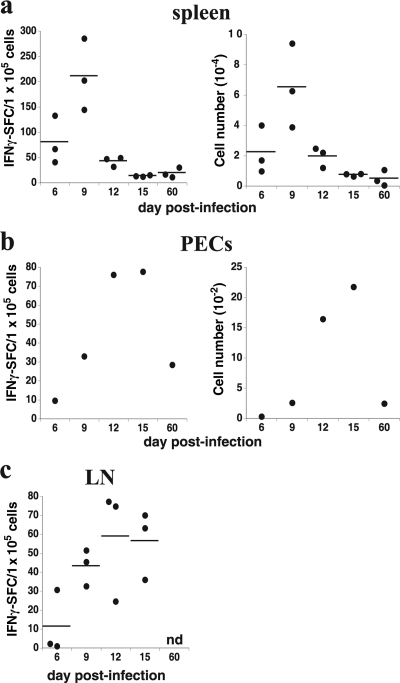
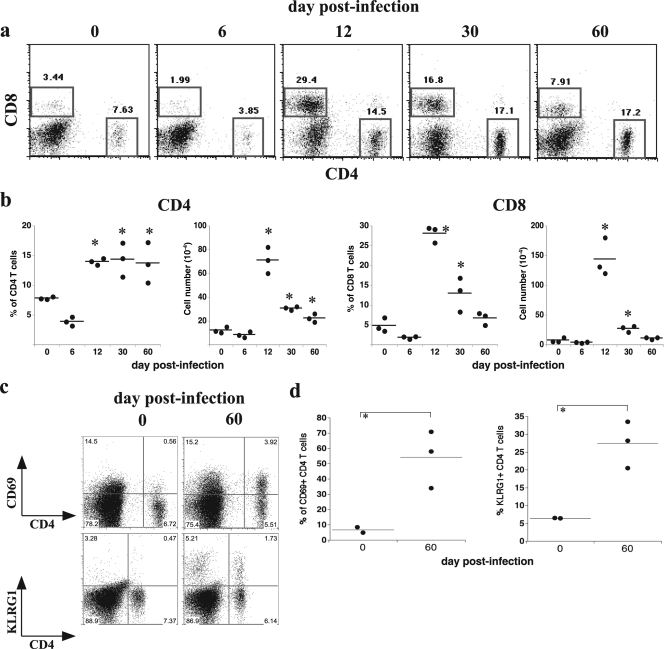
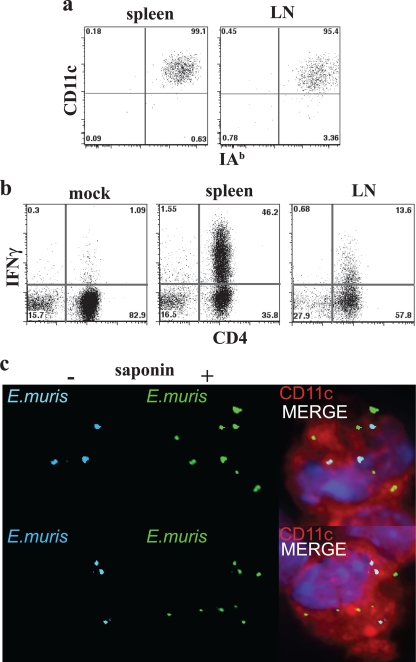
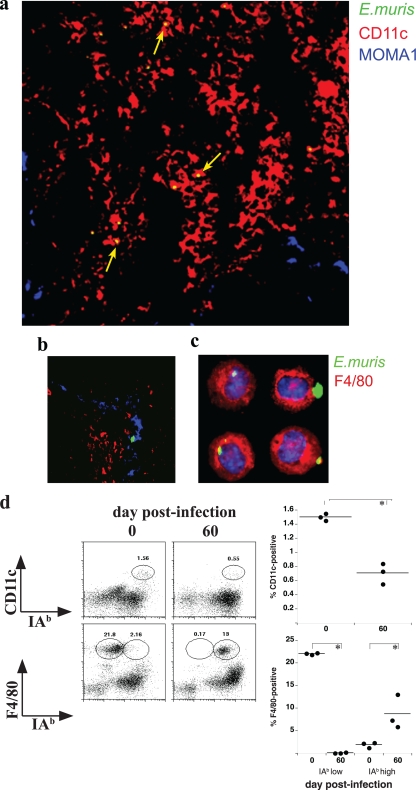
How spatial and temporal changes in major histocompatibility complex/peptide antigen presentation to CD4 T cells regulate CD4 T-cell responses during intracellular bacterial infections is relatively unexplored. We have shown that immunization with an ehrlichial outer membrane protein, OMP-19, protects mice against fatal ehrlichial challenge infection, and we identified a CD4 T-cell epitope (IA(b)/OMP-19(107-122)) that elicited CD4 T cells following either immunization or infection. Here, we have used an IA(b)/OMP-19(107-122)-specific T-cell line to monitor antigen display ex vivo during acute and chronic infection with Ehrlichia muris, a bacterium that establishes persistent infection in C57BL/6 mice. The display of IA(b)/OMP-19(107-122) by host antigen-presenting cells was detected by measuring intracellular gamma interferon (IFN-gamma) production by the T-cell line. After intravenous infection, antigen presentation was detected in the spleen, peritoneal exudate cells, and lymph nodes, although the kinetics of antigen display differed among the tissues. Antigen presentation and bacterial colonization were closely linked in each anatomical location, and there was a direct relationship between antigen display and CD4 T-cell effector function. Spleen and lymph node dendritic cells (DCs) were efficient presenters of IA(b)/OMP-19(107-122), demonstrating that DCs play an important role in ehrlichial infection and immunity. Chronic infection and antigen presentation occurred within the peritoneal cavity, even in the presence of highly activated CD4 T cells. These data indicated that the ehrlichiae maintain chronic infection not by inhibiting antigen presentation or T-cell activation but, in part, by avoiding signals mediated by activated T cells.


Figures

FIG. 1.
FIG. 1.
Detection of IAb/OMP-19107-122 antigen presentation. T-cell-depleted APCs were incubated with the OMP-19107-122-specific CD4 T-cell clone for 5 h in the presence of brefeldin A, and the T cells then were stained for intracellular IFN-γ. The T-cell clone was labeled with CFSE, and the CFSE-negative APCs were excluded from the flow cytometry analyses. (a) Uninfected T-cell-depleted spleen APCs (1 × 10⁶) were incubated with the T-cell clone in the absence or presence of OMP-19107-122. (b) Either T-cell-depleted spleen cells or PECs from a mock-infected or day 12-infected mice were incubated with the OMP-19107-122 T-cell line, as described for panel a. The data in panel b are representative of data obtained from three mice.
FIG. 2.
FIG. 2.
MHC/peptide antigen display during E. muris infection. Antigen presentation, tissue cellularity, bacterial infection, and the effects of antibiotic treatment were measured in the indicated tissues and anatomical locations after intravenous ehrlichial infection with 5 × 10⁴ bacteria. (a) T-cell-depleted APCs from spleen, within PECs, and pooled brachial, axillary, and inguinal LNs (1 × 10⁶ cells each) were analyzed for OMP-19107-122 antigen presentation on the indicated days postinfection using the approach described in the legend to Fig. 1. Each datum represents the determination from a single mouse. The data were compiled from several different infections. Horizontal lines indicate the mean values. The asterisks indicate statistically significant differences in values relative to the values of uninfected control APCs, as determined using the Mann-Whitney test (P < 0.05). The data were plotted after subtracting the background level obtained using uninfected control APCs. (b) Total spleen and peritoneal cavity mononuclear cell numbers were determined on the indicated days postinfection. (c) Bacterial copy numbers (per 10 ng of tissue DNA) were determined on the indicated days postinfection. (d) Mice were untreated or were administered doxycycline (doxy; 400 μg) on days 50, 54, and 57 postinfection, and ex vivo antigen presentation by spleen and peritoneal APCs was measured on day 60 postinfection. (e) Bacterial infection was measured in the mice analyzed in panel d. The experiment described for panels d and e was performed once. nd, not determined.
FIG. 3.
FIG. 3.
Kinetics of the effector CD4 T-cell response during infection. (a to c) CD4 T cells were purified from infected mice by magnetic bead negative selection and were incubated for 48 h with uninfected spleen APCs in the presence of recombinant OMP-19 (10 μg/ml). ELISpot analyses for IFN-γ were performed, and the frequency and number of spot-forming cells (SFCs) in the indicated tissues were determined (left and right panels, respectively). Each datum represents a determination from a single mouse, and horizontal lines indicate the mean values, except for the peritoneal cavity analyses (b), where the data represent the frequency and number of SFCs identified in pooled peritoneal lavage from three mice at each time point. n.d., not determined. All of the values obtained in cultures from the infected mice were statistically different from results of control assays, which were performed in the absence of OMP-19, or using an identically prepared irrelevant antigen (not shown). SFCs detected in wells that lacked peptide were negligible and were subtracted from the experimental samples. Very similar results were obtained using intraperitoneal infections in several related experiments.
FIG. 4.
FIG. 4.
T-cell expansion and persistence in the peritoneal cavity during acute and chronic infection. PECs were isolated by lavage and were analyzed for the presence of CD4 and CD8 T cells on the indicated days postinfection by flow cytometry. (a) Representative dot plots are shown; the analyses were performed after flow cytometric gating on viable cells. (b) The frequencies and numbers of CD4 and CD8 T cells detected in each of the mice analyzed in panel a are shown. An asterisk indicates a statistically significant difference in value, relative to the value of day 0 control samples, determined using the Mann-Whitney test (P < 0.05). The experiment was performed two times. (c) A representative flow cytometric analysis of surface expression of CD69 and KLRG1 on CD4 T cells obtained from the peritoneal cavity on day 60 postinfection and an aged-matched control mouse is shown. (d) The frequencies of CD4 T cells that expressed the markers analyzed in panel c are shown in the graphs.
FIG. 5.
FIG. 5.
DCs display antigen and harbor E. muris. DCs were purified from pooled day 5-infected spleens and LNs (n = 3), enriched by magnetic bead positive selection, and then purified by flow-cytometric cell sorting (95 to 99% purity was obtained). (a) Representative dot plots demonstrating the homogeneity of each of the purified DC populations. (b) OMP-19107-122 antigen presentation was measured in cultures containing the DCs, purified as described for panel a, from mock-infected mice (mock) or from spleen and LNs from mice on day 5 postinfection. The data are representative of two independent experiments of similar design; the average frequencies of IFN-γ-producing T cells were 43.7 and 13.6% for spleen and LNs, respectively. (c) DCs from mice on day 5 postinfection were purified by flow-cytometric cell sorting as shown in panel a and were stained with antibodies that recognize E. muris (Ec18.1) and CD11c. The staining for E. muris was performed using biotinylated Ec18.1. The cells first were stained using streptavidin-conjugated Alexafluor-594 (pseudocolored cyan in the figure), permeabilized with 0.2% saponin, blocked, and stained again with streptavidin-conjugated Alexafluor-488 (shown in green). Thus, the cyan-colored bacteria are surface-associated bacteria, and the green bacteria represent all of the bacteria associated with the host cell. The merged image, which also includes CD11c staining (in red), is shown in the panels at the right. Nuclei were counterstained with 4′,6′-diamidino-2-phenylindole (blue in nuclei). The top and bottom rows show two representative fields of cells.
FIG. 6.
FIG. 6.
E. muris infection of APCs in situ. Spleen tissue was harvested from a mouse on day 6 postinfection, sectioned, and stained using the antibodies described in the legend to Fig. 5c and MOMA-1, which recognizes MZ metallophilic macrophages. (a) A representative merged image of a portion of a spleen is shown. CD11c staining is shown in red, and MOMA-1-positive macrophages are shown in blue. The bacteria were stained with biotinylated Ec18.1 and streptavidin-conjugated Alexafluor-488; these were imaged as green but appear yellow in the merged panel, because they are present in the red CD11c-positive DCs (yellow arrows). (b) Representative image from a portion of a spleen section showing bacteria residing in MOMA-1-positive macrophages (blue arrows). (c) PECs were isolated from a mouse on day 30 postinfection, and the cells were stained using fluorescein isothiocyanate-conjugated F4/80 (pseudocolored in red) and biotinylated Ec18.1, followed by Alexafluor-647 (pseudocolored in green). Nuclei were stained with 4′,6′-diamidino-2-phenylindole; the large green structures containing the fluorescent bacteria are morulae. (d) PECs from day 60 postinfection and age-matched control mice were monitored by flow cytometry for the surface expression of CD11c and F4/80 on class II IAb-positive and -negative cells (left). The percentages of the gated populations within the live cell gate are shown in each plot. The right panels show the frequencies of CD11c- and F4/80-positive cells in the indicated populations from each of the mice analyzed.

Similar articles

Cited by

References

    1. Agerer, F., S. Waeckerle, and C. R. Hauck. 2004. Microscopic quantification of bacterial invasion by a novel antibody-independent staining method. J. Microbiol. Methods 59:23-32. - PubMed
    1. Badovinac, V. P., B. B. Porter, and J. T. Harty. 2002. Programmed contraction of CD8+ T cells after infection. Nat. Immunol. 3:619-626. - PubMed
    1. Balázs, M., F. Martin, T. Zhou, and J. Kearney. 2002. Blood dendritic cells interact with splenic marginal zone B cells to initiate T-independent immune responses. Immunity 17:341-352. - PubMed
    1. Bitsaktsis, C., B. Nandi, R. Racine, K. C. MacNamara, and G. Winslow. 2007. T cell-independent humoral immunity is sufficient for protection against fatal intracellular ehrlichia infection. Infect. Immun. 75:4933-4941. - PMC - PubMed
    1. Bitsaktsis, C., and G. Winslow. 2006. Fatal recall responses mediated by CD8 T cells during intracellular bacteria infection. J. Immunol. 177:4644-4651. - PubMed

Publication types