. 2009 Oct;77(10):4314-26.
doi: 10.1128/IAI.00654-09. Epub 2009 Jul 27.

Vaccination with an attenuated strain of Francisella novicida prevents T-cell depletion and protects mice infected with the wild-type strain from severe sepsis

Affiliations

Vaccination with an attenuated strain of Francisella novicida prevents T-cell depletion and protects mice infected with the wild-type strain from severe sepsis

Jyotika Sharma et al. Infect Immun. 2009 Oct.

Abstract

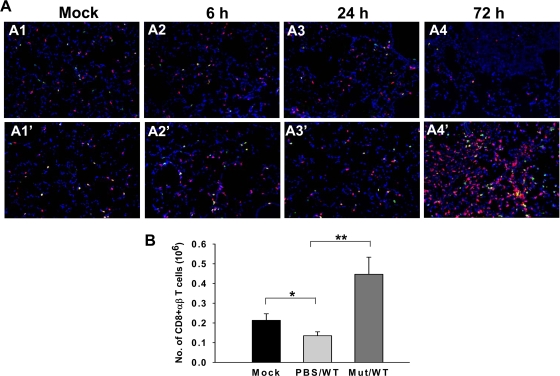
Francisella tularensis is the causative agent of zoonotic tularemia, a severe pneumonia in humans, and Francisella novicida causes a similarly severe tularemia in mice upon inhalation. The correlates of protective immunity, as well as the virulence mechanisms of this deadly pathogen, are not well understood. In the present study, we compared the host immune responses of lethally infected and vaccinated mice to highlight the host determinants of protection from this disease. Intranasal infection with an attenuated mutant (Mut) of F. novicida lacking a 58-kDa hypothetical protein protected C57BL/6 mice from a subsequent challenge with the fully virulent wild-type strain U112 via the same route. The protection conferred by Mut vaccination was associated with reduced bacterial burdens in systemic organs, as well as the absence of bacteremia. Also, there was reduced lung pathology and associated cell death in the lungs of vaccinated mice. Both vaccinated and nonvaccinated mice displayed an initial 2-day delay in upregulation of signature inflammatory mediators after challenge. Whereas the nonvaccinated mice developed severe sepsis characterized by hypercytokinemia and T-cell depletion, the vaccinated mice displayed moderated cytokine induction and contained increased numbers of alphabeta T cells. The recall response in vaccinated mice consisted of a characteristic Th1-type response in terms of cytokines, as well as antibody isotypes. Our results show that a regulated Th1 type of cell-mediated and humoral immunity in the absence of severe sepsis is associated with protection from respiratory tularemia, whereas a deregulated host response leading to severe sepsis contributes to mortality.


Figures

FIG. 1.
FIG. 1.
Intranasal vaccination with the mutant lacking the 58-kDa protein gene protects mice from a lethal challenge with F. novicida. Mice were inoculated intranasally with 3 × 10² CFU of Mut bacteria in 20 μl of PBS or with PBS alone. Three weeks later, the mice were challenged with various doses of WT F. novicida. (A) Survival of the mice vaccinated with Mut or PBS alone and challenged with 3 × 10², 1.2 × 10³, or 4.8 × 10³ CFU of WT bacteria. The survival of mice was recorded daily for 4 weeks. Mice vaccinated with PBS alone and challenged with WT bacteria (PBS/WT) showed disease symptoms by 72 h p.c., became moribund, and succumbed to infection by 120 h p.c., whereas mutant-vaccinated mice (Mut/WT) remained healthy throughout the infection period. In this representative of three experiments each group contained 10 mice. Ch-3 X10², Ch-1.2 X10², and Ch-4.8 X10², challenge with 3 × 10², 1.2 × 10², and 4.8 × 10² CFU, respectively. (B) Bacterial burdens in lungs harvested from PBS/WT and Mut/WT mice at 6, 24, 72, and 120 h after challenge with 3 × 10² CFU of the WT bacteria. The mice vaccinated with Mut bacteria had lower bacterial loads upon challenge with WT bacteria than the PBS/WT mice at all times after challenge tested. By 120 h p.c. the bacterial burden in Mut/WT mice was reduced, whereas the bacterial burden remained high in PBS/WT mice at that time. In this representative of three independent experiments each group contained three to five mice. (C) Bacterial burdens in blood of Mut/WT and PBS/WT mice challenged with 3 × 10² CFU of WT bacteria. No bacterial loads were detected in blood from Mut/WT mice at any time after challenge tested. In this representative of three independent experiments each group contained three to five mice.
FIG. 2.
FIG. 2.
Mut/WT (vaccinated) mice display reduced lung pathology compared with PBS/WT mice. Mice were vaccinated intranasally with 3 × 10² CFU of the Mut bacteria or with PBS alone. Three weeks later, the mice were challenged with 3 × 10² CFU of the WT bacteria intranasally. Mock-infected control mice received PBS alone. At 6, 24, and 72 h p.c. the lungs of Mut/WT and PBS/WT mice were isolated, sectioned, and stained with hematoxylin and eosin. (A1, A2, and A3) Representative sections from lungs of mock-infected mice at 6, 24, and 72 h p.c., respectively. (B1, B2, and B3) Representative lung sections from PBS/WT mice at 6, 24, and 72 h p.c., respectively. (C1, C2, and C3) Representative lung sections from Mut/WT mice at 6, 24 and 72 h p.c., respectively. The box in panel C2 indicates infiltrating cells in the peribronchial area. The results are from one representative of three experiments performed, and in each experiment each group contained three mice. Magnification, ×200.
FIG. 3.
FIG. 3.
Mice vaccinated with the mutant exhibit reduced cell death after challenge with the WT bacteria. Lungs from mice vaccinated with the Mut (Mut/WT) or PBS (PBS/WT) were harvested 72 h after challenge with the WT bacteria, embedded in optimal-cutting-temperature compound, and sectioned as described in Materials and Methods. In situ TUNEL was used for detection of DNA fragmentation (red) in nuclei. Nuclei (blue) were stained with 4′,6′-diamidino-2-phenylindole dilactate. Magnification, ×100.
FIG. 4.
FIG. 4.
Infiltration of Gr1+ cells in lungs of mock-infected, Mut/WT, and PBS/WT mice. Mice were vaccinated intranasally with 3 × 10² CFU of the Mut bacteria in 20 μl of PBS or with 20 μl of PBS alone. Three weeks later mice were challenged with 3 × 10² CFU of the WT bacteria. Mock-infected control mice received 20 μl of PBS alone. At 72 h p.c. the lungs of mice were isolated and sectioned. Gr1+ cells (red) were visualized by in situ IF staining using a purified rat anti-mouse Gr1 monoclonal antibody (clone Ly-6G), followed by rhodamine red X-conjugated Affipure goat anti-rat IgG. (A1 and A1′) Gr1+ cells in mock-infected control mice. (A2, A3, and A4) Gr1+ staining in PBS/WT mice at 6, 24, and 72 h p.c., respectively. (A2′, A3′, and A4′) Gr1+ cells in Mut/WT mice at 6, 24, and 72 h p.c., respectively. Nuclei (blue) were stained with 4′,6′-diamidino-2-phenylindole dilactate. (Insets) Higher-magnification images. The images are from one representative experiment of three performed, and in each experiment there were three or four mice in each group. Magnification, ×200.
FIG. 5.
FIG. 5.
Infiltration of αβ T cells in lungs of mock-infected, Mut/WT, and PBS/WT mice. Lungs from Mut- or PBS-inoculated mice were harvested at 72 h after challenge with the WT bacteria. Mock-infected control mice received 20 μl of PBS alone. αβ T cells (red) were visualized by in situ IF staining using an R-PE-conjugated anti-mouse αβ TCR β chain monoclonal antibody. (A1 and A1′) αβ T cells in mock-infected control mice. (A2, A3, and A4) αβ T-cell staining in PBS/WT mice at 6, 24, and 72 h p.c., respectively. (A2′, A3′, and A4′) αβ T cells in Mut/WT mice at 6, 24, and 72 h p.c., respectively. Nuclei (blue) were stained with 4′,6′-diamidino-2-phenylindole dilactate. The images are from one representative experiment of three, and in each experiment there were three or four mice in each group. Magnification, ×200.
FIG. 6.
FIG. 6.
Flow cytometry analyses of cellular infiltrates in PBS/WT and Mut/WT mouse lungs. Lung cells were isolated from mock-infected, PBS/WT, and Mut/WT mice after challenge with 3 × 10² CFU of the WT bacteria by collagenase treatment at 72 h p.c. The cells were stained with (top panel) anti-Gr1-APC, (middle panel) anti-CD11b-phycoerythrin, or (bottom panel) anti-αβ TCR β chain-phycoerythrin. Appropriate isotype-matched negative controls were used to set the gates. The levels of positively stained cells are expressed as percentages of the total lung cell population. The total numbers of lung cells in this representative experiment were 7.2 × 10⁶ ± 0.4 × 10⁶ cells for mock-infected mice, 10.3 × 10⁶ ± 0.7 × 10⁶ cells for PBS/WT mice, and 14.0 × 10⁶ ± 1.2 × 10⁶ cells for Mut/WT mice. AThe average percentages of positive cells from three mice from a representative of three experiments are indicated. *, P < 0.05; **, P < 0.005; ***, P < 0.0001.
FIG. 7.
FIG. 7.
The number of CD4+ αβ T cells is highly upregulated in vaccinated Mut/WT mice. (A) In situ IF staining was performed with frozen lung sections from mock-infected control, nonvaccinated PBS/WT, or vaccinated Mut/WT mice at various times after challenge with 3 × 10² CFU of the WT bacteria. The sections were stained with anti-αβ TCR β chain-phycoerythrin (red) and anti-CD4, followed by Alexa 488-conjugated secondary antibody (green). (A1 and A1′) Lungs from mock-infected control mice. (A2, A3, and A4) Lungs from PBS/WT mice at 6, 24, and 72 h p.c., respectively. (A2′, A3′, and A4′) Lungs from Mut/WT mice at 6, 24, and 72 h p.c, respectively. Representative images from two independent experiments, each with three or four mice per group, are shown. Magnification, ×100. (B) Lung cells from mock-infected, PBS/WT, and Mut/WT mice were analyzed for CD4+ αβ T cells by FACS at 72 h p.c. The cells were simultaneously stained with anti-αβ TCR β chain-phycoerythrin and anti-CD4-APC-Cy7. Lung cells stained singly for αβ TCR β chain or CD4 were used to set the gates. The data for double-positive cells in dot plots are expressed as percentages of the total lung cell population. Absolute numbers are shown in the bar graph. The total numbers of lung cells in this representative experiment were 7.76 × 10⁶ ± 0.52 × 10⁶ cells for mock-infected animals, 11.0 × 10⁶ ± 0.81 × 10⁶ cells for PBS/WT animals, and 14.66 × 10⁶ ± 1.85 × 10⁶ cells for Mut/WT animals. The average numbers of CD4+ αβ T cells in lungs from three mice from a representative of two experiments are shown in the bar graph. ***, P < 0.0005.
FIG. 8.
FIG. 8.
The number of CD8+ αβ T cells is upregulated in vaccinated Mut/WT mice. (A) In situ IF staining was performed with frozen lung sections from mock-infected control, nonvaccinated PBS/WT, or vaccinated Mut/WT mice at various times after challenge with 3 × 10² CFU of the WT bacteria. The sections were stained with anti-αβ TCR β chain-phycoerythrin (red) and anti-CD8, followed by Alexa 488-conjugated secondary antibody (green). (A1 and A1′) Lungs from mock-infected control mice. (A2, A3, and A4) Lungs from PBS/WT mice at 6, 24, and 72 h p.c., respectively. (A2′, A3′, and A4′) Lungs from Mut/WT mice at 6, 24, and 72 h p.c, respectively. Representative images from two independent experiments, each with three or four mice per group, are shown. Magnification, ×100. (B) Lung cells from mock-infected, PBS/WT, and Mut/WT mice were analyzed for CD8+ αβ T cells by FACS at 72 h p.c. The cells were simultaneously stained with anti-αβ TCR β chain-phycoerythrin and anti-CD8-Alexa-647-Cy7. Lung cells stained singly for αβ TCR β chain or CD8 were used to set the gates. The average total numbers of double-positive cells from three mice from a representative of two experiments are shown. The total numbers of lung cells in this representative experiment were 7.76 × 10⁶ ± 0.52 × 10⁶ cells for mock-infected animals, 11.0 × 10⁶ ± 0.81 × 10⁶ cells for PBS/WT animals, and 14.66 × 10⁶ ± 1.85 × 10⁶ cells for Mut/WT animals. *, P < 0.05; **, P < 0.005.
FIG. 9.
FIG. 9.
Intranasal vaccination with Mut bacteria elicits differential upregulation of Th1 cytokines, while lethal infection results in hypercytokinemia. The lungs from mock-infected, Mut/WT, and PBS/WT mice were harvested at 6 h, 24 h, 72 h, and 120 h after challenge with the WT bacteria and homogenized in PBS with protease inhibitors, and the rodent multianalyte profile (Rules-Based Medicine, Austin, TX) was analyzed. In order to analyze cytokines elicited specifically after challenge with the WT bacteria, lungs of mice inoculated with Mut for 3 weeks but not challenged with the WT strain (Mut-3wk) were processed similarly. The data are averages for three infected and mock-infected control mice from two or three independent experiments. Statistical comparisons between experimental groups were performed with Student's t test using Sigma Plot 8.0. LTN, lymphotactin; MDC, macrophage-derived chemokine; GM-CSF, granulocyte-macrophage colony-stimulating factor.
FIG. 10.
FIG. 10.
Vaccination with Mut induces a predominant Th1-type antibody response. Mice were intranasally vaccinated with 3 × 10² CFU of Mut for 3 weeks, and this was followed by challenge with similar doses of WT bacteria (Mut/WT) or Mut bacteria (Mut/Mut). Sera were harvested from these mice 2 weeks after challenge, and the titers of individual anti-Francisella antibody isotypes were determined by isotype-specific ELISA. In order to analyze antibody responses elicited specifically after the challenge, sera from mice inoculated with Mut for 3 weeks (Mut-3wk) were processed similarly. The data are representative of the data for three mice from two or three independent experiments. Statistical comparisons were performed with Student's t test using Sigma Plot 8.0. *, P < 0.05.
FIG. 11.
FIG. 11.
Expression of S100A9, a DAMP protein, in the lungs of mock-infected, Mut/WT, and PBS/WT mice. (A1 and A1′) S100A9 expression in mock-infected control lungs. (A2, A3, and A4) PBS/WT lungs at 6, 24, and 72 h p.c., respectively. (A2′, A3′, and A4′) Mut/WT lungs at 6, 24, and 72 h p.c., respectively. The images are from one representative experiment of two experiments performed with three or four mice per group. Magnification, ×200. (B) Lung homogenates from mock-infected control mice (lane 1) and from PBS/WT mice (lanes 2 to 5) or Mut/WT mice (lanes 6 to 9) at 6, 24, 72, and 120 h p.c., respectively, were run on polyacrylamide gels, transferred to polyvinylidene difluoride membranes, and probed with anti-S100A9 antibody. Immunoblotting with anti-glyceraldehyde-3-phosphate dehydrogenase (GAPDH) antibody was performed to monitor equal loading of samples. The data represent the data from at least three independent experiments.

References

    1. Bakshi, C. S., M. Malik, M. Mahawar, G. S. Kirimanjeswara, K. R. Hazlett, L. E. Palmer, M. B. Furie, R. Singh, J. A. Melendez, T. J. Sellati, and D. W. Metzger. 2008. An improved vaccine for prevention of respiratory tularemia caused by Francisella tularensis SchuS4 strain. Vaccine 26:5276-5288. - PMC - PubMed
    1. Bosio, C. M., H. Bielefeldt-Ohmann, and J. T. Belisle. 2007. Active suppression of the pulmonary immune response by Francisella tularensis Schu4. J. Immunol. 178:4538-4547. - PubMed
    1. Bosio, C. M., and S. W. Dow. 2005. Francisella tularensis induces aberrant activation of pulmonary dendritic cells. J. Immunol. 175:6792-6801. - PubMed
    1. Bosio, C. M., and K. L. Elkins. 2001. Susceptibility to secondary Francisella tularensis live vaccine strain infection in B-cell-deficient mice is associated with neutrophilia but not with defects in specific T-cell-mediated immunity. Infect. Immun. 69:194-203. - PMC - PubMed
    1. Chiavolini, D., J. Alroy, C. A. King, P. Jorth, S. Weir, G. Madico, J. R. Murphy, and L. M. Wetzler. 2008. Identification of immunologic and pathologic parameters of death versus survival in respiratory tularemia. Infect. Immun. 76:486-496. - PMC - PubMed

Publication types

MeSH terms