. 2009 Jul 27;186(2):255-68.
doi: 10.1083/jcb.200903070.

Autophagy pathway intersects with HIV-1 biosynthesis and regulates viral yields in macrophages

Affiliations

Autophagy pathway intersects with HIV-1 biosynthesis and regulates viral yields in macrophages

George B Kyei et al. J Cell Biol. .

Abstract

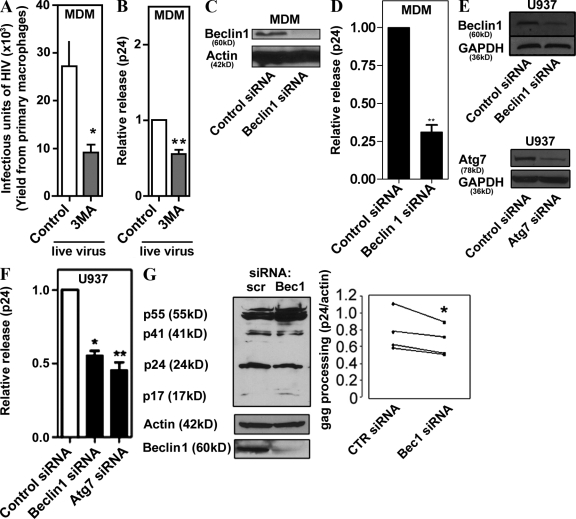
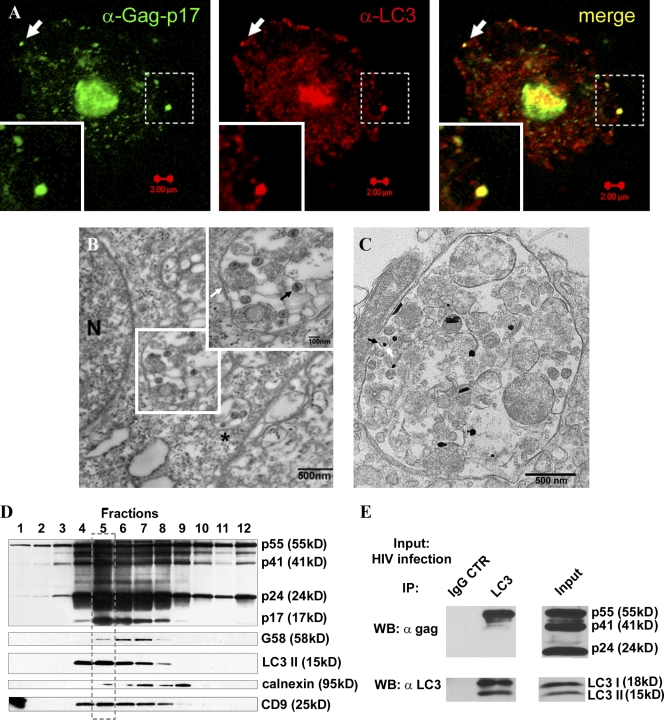
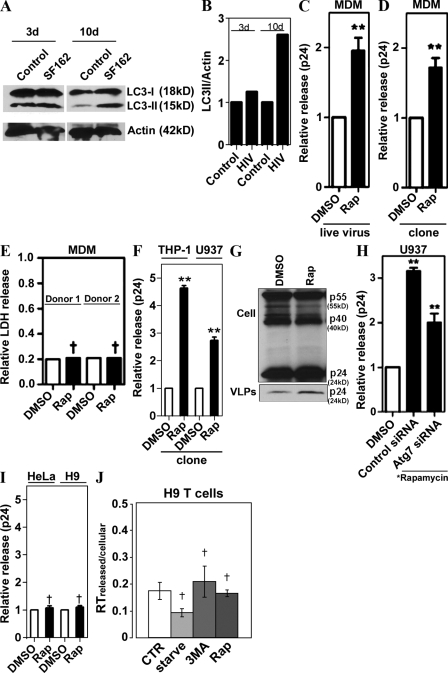
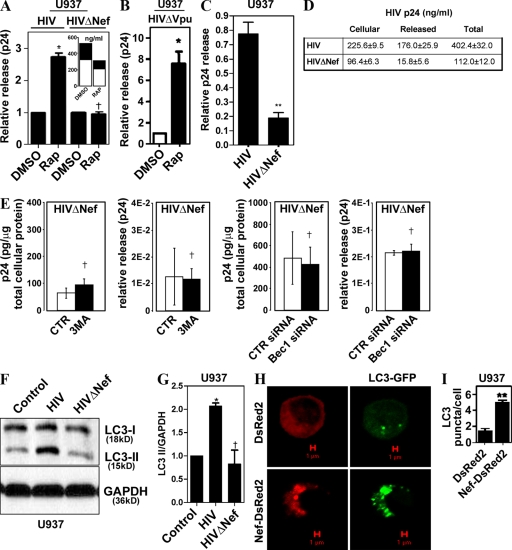
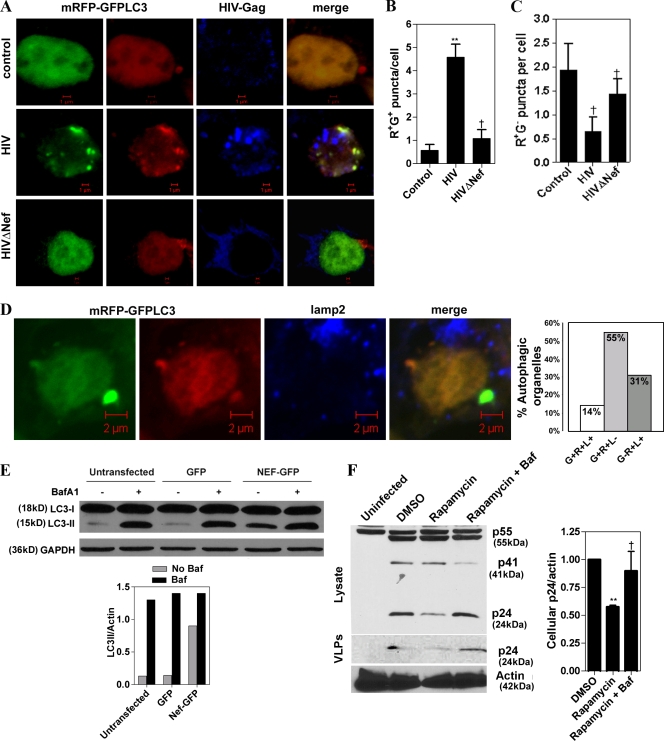
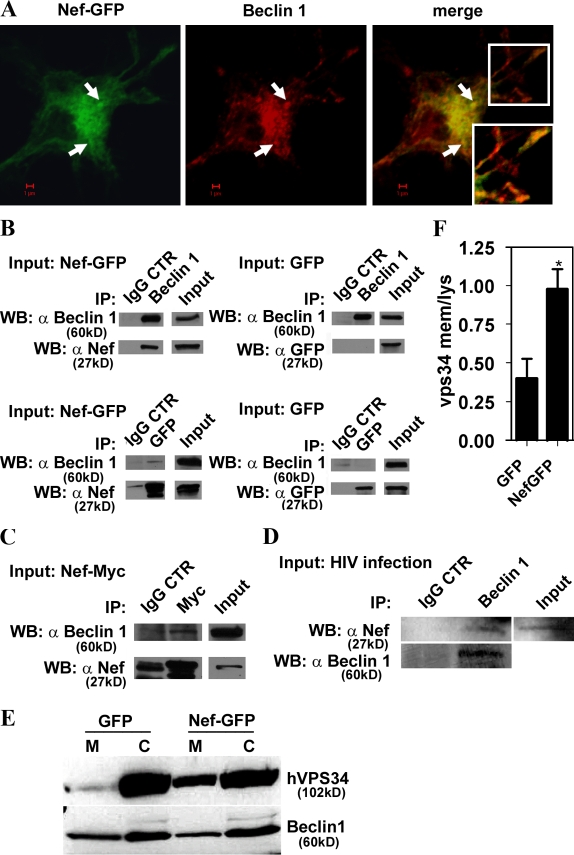
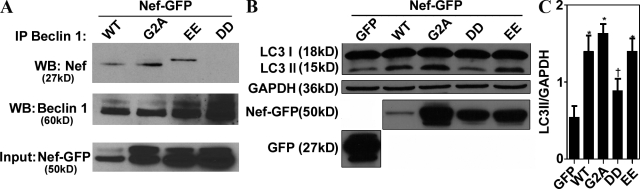
Autophagy is a cytoplasmic degradative pathway that can participate in biosynthetic processes, as in the yeast Cvt pathway, but is more commonly known for its functions in removing damaged or surplus organelles and macromolecular complexes. Here, we find that autophagy intersects with human immunodeficiency virus (HIV) biogenesis, mirroring the above dichotomy. Early, nondegradative stages of autophagy promoted HIV yields. HIV Gag-derived proteins colocalized and interacted with the autophagy factor LC3, and autophagy promoted productive Gag processing. Nevertheless, when autophagy progressed through maturation stages, HIV was degraded. This, however, does not occur, as the HIV protein Nef acts as an antiautophagic maturation factor through interactions with the autophagy regulatory factor Beclin 1, thus protecting HIV from degradation. The dual interaction of HIV with the autophagy pathway enhances viral yields by using the early stages while inhibiting the late stages of autophagy. The role of Nef in the latter process enhances yields of infectious HIV and may be of significance for progression to clinical AIDS.


Figures

Figure 1.
Figure 1.
Autophagy is required for optimal HIV yields in macrophages. (A) Pharmacological blockage of autophagy inhibits release of infectious virions. Human peripheral blood MDM were infected with SF162 HIV-1 for 10 d, then washed and incubated with control media or 3MA for 4.5 h. Culture supernatants containing HIV particles were used for a MAGI infectivity assay as described in Materials and methods. (B) Relative viral release was calculated as a ratio of extracellular-to-intracellular Gag-derived core antigen capsid protein CA (p24) and normalized to the control. (C) Western blot showing siRNA knockdown of Beclin 1, 7 d after transfection in MDM. (D) Human MDM were transfected with siRNA to Beclin 1 and infected with SF162 HIV-1 for 7 d, then p24 yields were quantified. (E) Western blots showing siRNA knockdown of Beclin 1 and Atg7 48 h after transfection in U937 cells. (F) Knockdown of autophagy regulators Atg7 and Beclin 1 inhibits basal viral yields released from macrophages. U937 cells were cotransfected with Beclin 1 or Atg7 siRNA and pMSMBA (a clone of NL4-3). Data indicate means; error bars indicate ±SEM (n ≥ 3). *, P < 0.05; **, P < 0.01; †, P > 0.05 (analysis of variance [ANOVA]). (G) U937 cells were knocked down for Beclin 1 expression and infected with VSV-G–pseudotyped HIV. Cell lysates were performed for Gag processing analysis. *, P < 0.05, paired t test.
Figure 2.
Figure 2.
Autophagy protein LC3 colocalizes, copurifies, and coprecipitates with HIV Gag. (A) MDM were infected with VSV-G–pseudotyped HIV and immunostained for Gag-p17 and LC3. Arrows, a peripheral structure as an example of Gag-p17 and LC3 overlap. (B) Ultrastructural analysis of HIV virions in macrophages infected with HIV. U937 cells were infected with VSV-G–pseudotyped HIV. (inset) Enlarged region boxed in the electron micrograph. White arrow, membrane; black arrow, HIV virion; asterisk, HIV virions in a membranous compartment with a clathrin-coated pit consistent with plasma membrane origin. An enlarged image of this profile is shown in Fig. S1 C. (C) HIV-containing compartments are positive for LC3. Immunoelectron microscopy showing gold particles (enhanced gold particles appear globular, oval, and acicular) of LC3 in HIV-containing compartments. Arrow: virion and LC3 gold particle. See Fig. S1 D for p24 immunoelectron microscopy analysis. (D) HIV Gag precursor and Gag-derived proteins cofractionate with LC3 and the tetraspanin CD9. Subcellular organelle fractionation via isopycnic sucrose gradient separation was performed with lysates from HIV-infected cells (see Materials and methods). 12 fractions starting from the top were immunoblotted for the indicated proteins and organellar markers. The box with the broken line indicates peak band intensity fractions for LC3-II, Gag, and Gag-derived polypeptides, and CD9. (E) HIV Gag coimmunoprecipitates with LC3. U937 cells were infected with HIV and lysates immunoprecipitated for LC3. Immunoblotting with p24 and LC3 antibodies was performed on lysate and immunoprecipitate samples. The p24 antibody recognizes all three Gag proteins, as shown in the input. Note that only the precursor Gag-p55 comes down in immunoprecipitates with LC3 (n = 3).
Figure 3.
Figure 3.
Induction of autophagy enhances HIV yields. (A) Human peripheral blood MDM were infected with SF162 HIV-1 for 3 or 10 d, and lysates were immunoblotted for LC3 (one of two equal experiments shown). (B) Quantification: LC3-II band intensity relative to actin. Representative data from one of two independent experiments. (C and D) Induction of autophagy promotes viral yields from MDM. (C) MDM were infected with SF162 HIV for 10 d, then washed and incubated with DMSO or 50 µg/ml rapamycin for 4 h. (D) MDM were transfected with a pMSMBA HIV clone for 48 h, then washed and incubated with DMSO or 50 µg/ml rapamycin for 4 h. Core antigen capsid protein (p24) was measured as in Fig. 1. (E) Assessment of nonspecific cytosolic release. Extracellular lactate dehydrogenase (LDH) release assay was performed with a kit from Promega according to manufacturer’s instructions using lysates and media from cells treated with DMSO or rapamycin. Relative LDH was calculated as the ratio between extracellular and total LDH, released from MDM from two different donors. (F) Induction of autophagy increases p24 yields in human monocytic cell lines. THP-1 and U937 cells differentiated into macrophages were transfected with pMSMBA for 48 h, then washed and incubated with DMSO or rapamycin for 4 h. (G) Induction of autophagy increases release of VLPs in human macrophages. U937 cells were infected with VSV-G–pseudotyped pMSMBA-derived virus for 48 h, then washed and treated for 5 h with rapamycin or DMSO alone. VLPs were isolated on a 20% sucrose cushion, and lysates and VLP were immunoblotted for Gag and p24, respectively. (H) U937 cells were cotransfected with siRNA and pMSMBA for 48 h, then washed and incubated with DMSO alone or 50 µg/ml rapamycin for 4 h. (I) HeLa and H9 cells were transfected with pMSMBA for 48 h, then washed and incubated with DMSO or rapamycin for 4 h, and relative viral release (p24) was determined. (J) H9 cells (a T cell line) were infected with T cell tropic HIVLAI for 4 d and washed; relative viral release was found by determining the ratios of extracellular versus intracellular reverse transcription levels. Data indicate means; error bars indicate ±SEM (n ≥ 3). *, P < 0.05; **, P < 0.01; †, P > 0.05 (ANOVA).
Figure 4.
Figure 4.
Nef is required for yield-enhancing effects of autophagy on HIV. (A) U937 cells were transfected with pGFP-NL4-3ΔNef (HIVΔNef) for 48 h and incubated with DMSO or 50 µg/ml of rapamycin. (inset) Absolute values of p24 concentrations in cells (open bars) and released into the medium (shaded bars). Note that absolute levels of ΔNef virus are inhibitable by rapamycin but that the ratios of released versus cell-associated virus remain the same, as reflected in the main graph. (B) U937 cells were transfected with pMSMBA-vpu-null (HIVΔVpu) and tested as in A for rapamycin effects. (C) U937 cells were infected with 100 ng/ml each of VSV-G–pseudotyped HIV or HIVΔNef for 48 h, and p24 yields were quantified. (D) Absolute levels of cell-associated, released, and total p24 from samples in B. (E) Absence of basal autophagy inhibition effects on HIVΔNef yields. For experiments with 3MA, U937 cells were infected with NL4-3ΔNef for 48 h, then washed and treated for 4 h. Cells in experiments with Beclin 1 knockdowns were first transfected with siRNA, infected 24 h later, and harvested 48 h after infection. CTR, control. (F and G) Nef increases LC3-II (lapidated form). U937 cells were infected with VSV-G–pseudotyped pMSMBA-derived virus (HIV) or HIVΔNef for 3 d and immunoblotted for LC3. (E) Immunoblot. (F) Quantification (ratio of LC3-II to GAPDH band intensities). (H) U937 macrophages were cotransfected with GFP-LC3 and either DsRed2 or Nef-DsRed2 for 24 h. GFP-LC3 puncta were quantified in three independent experiments. (I) Quantification of LC3 puncta (≥1 µm) per cell. Data indicate means; error bars indicate ±SEM (n ≥ 3). *, P < 0.05; **, P < 0.01; †, P > 0.05 (ANOVA).
Figure 5.
Figure 5.
Nef inhibits autophagic maturation. (A) Nef blocks maturation of early autophagic organelles into autolysosomes. 293T cells were infected with VSV-G–pseudotyped HIV or HIVΔNef and transfected with mRFP-GFP-LC3 for 48 h, then immunostained for Gag and analyzed by confocal microscopy. Based on differential pH sensitivity of RFP and GFP, the mRFP-GFP-LC3 probe differentiates between early, nonacidified autophagosomes (red+green+; yellow in merged images) from acidified, degradative autolysosomes (red+green; red in merged images). (B and C) Quantification of (red+green+) R+G+ and R+G puncta per cell, respectively. (D) Analysis of Lamp2 association with RGP-GFP-LC3 profiles in HIV-infected 293T cells (HIV infection of >90% determined by staining with antibody to Gag). L+, percentage of Lamp2-positive profiles; L, percentage of Lamp2-negative profiles. Data are from 42 cells from three slides. (E) LC3-II levels in Nef-transfected cells in the presence or absence of bafilomycin A1. 293T cells were transfected with GFP alone or Nef-GFP for 48 h. Cells were then incubated with or without bafilomycin A1 (Baf A1 or Baf) for 4 h and immunoblotted for LC3 and GAPDH. (E, bottom) Quantification: LC3/GAPDH ratios, representative of one of two experiments. (F) Inhibition of autophagic flux/maturation protects Nef-null virus from degradation. U937 cells were infected with VSV-G–pseudotyped HIVΔNef for 72 h, then washed and treated with rapamycin or rapamycin plus bafilomycin A1 (100 nM) for 5 h. VLP and cell lysates were subjected to immunoblot analysis. (F, right) Quantification of cellular p24 (n = 3). Data indicate means; error bars indicate ±SEM. *, P < 0.05; **, P < 0.01; †, P ≥ 0.05 (ANOVA).
Figure 6.
Figure 6.
Nef is in protein complexes with autophagy regulator Beclin 1. (A) Macrophages were transfected with Nef-GFP and immunostained for Beclin 1. Arrows, perinuclear profiles exemplifying Nef and Beclin 1 colocalization. (inset) Peripheral colocalization. (B) 293T cells were transfected with Nef-GFP or GFP alone for 48 h. Lysates were immunoprecipitated either with Beclin 1 antibody and immunoblotted with Nef antibody (top) or with GFP and immunoblotted for Beclin 1 (bottom). Specific protein levels in cell lysates (input) and immunoprecipitates with IgG controls are shown. (C) Coimmunoprecipitation of Beclin 1 with Nef-Myc. 293T cells were transfected with Nef-Myc for 48 h, then cells were lysed and immunoprecipitation was performed using monoclonal Myc antibody or IgG control. Western blots were probed with Beclin 1 or Nef antibodies. The blots shown represent one of four independent experiments. (D) U937 cells were infected for 48 h with VSV-G–pseudotyped HIV. Cells were lysed and immunoprecipitated with Beclin 1–specific antibody or control IgG. Western blots of immunoprecipitated material were probed with Nef antibody. (E and F) 293T cells were cotransfected with Nef-GFP or GFP and Flag-hVPS34 for 48 h. Cells were fractionated into membranes (M) and cytosol (C) and immunoblotted with anti-Flag and Beclin 1 antibodies. (E) Immunoblots. (F) Quantification (ratios of membrane-associated hVPS34 to cytosolic hVPS34. Data indicate means; error bars indicate ±SEM. *, P < 0.05 (n = 3).
Figure 7.
Figure 7.
Nef 174DD175 motif is required for interaction with Beclin 1 and inhibition of autophagic maturation. (A) 293T cells were transfected with the wild-type HIV-1 Nef fusion with GFP or the indicated mutants: G2ANefGFP, 154EE-QQ155NefGFP, and 174DD-AA175NefGFP for 48 h. Beclin 1 immunoprecipitates were analyzed by immunoblotting. (B and C) 293T cells were transfected with the indicated constructs and immunoblotted for LC3. (B) Immunoblot. (C) Quantification (ratio of LC3-II to GAPDH band intensities). Data indicate means; error bars indicate ±SEM. *, P < 0.01; †, P ≥ 0.05 (ANOVA; n = 3).

References

    1. Barre-Sinoussi F., Chermann J.C., Rey F., Nugeyre M.T., Chamaret S., Gruest J., Dauguet C., Axler-Blin C., Vezinet-Brun F., Rouzioux C., et al. 1983. Isolation of a T-lymphotropic retrovirus from a patient at risk for acquired immune deficiency syndrome (AIDS).Science. 220:868–871 - PubMed
    1. Bentham M., Mazaleyrat S., Harris M. 2006. Role of myristoylation and N-terminal basic residues in membrane association of the human immunodeficiency virus type 1 Nef protein.J. Gen. Virol. 87:563–571 - PubMed
    1. Birmingham C.L., Smith A.C., Bakowski M.A., Yoshimori T., Brumell J.H. 2006. Autophagy controls Salmonella infection in response to damage to the Salmonella-containing vacuole.J. Biol. Chem. 281:11374–11383 - PubMed
    1. Birmingham C.L., Canadien V., Kaniuk N.A., Steinberg B.E., Higgins D.E., Brumell J.H. 2008. Listeriolysin O allows Listeria monocytogenes replication in macrophage vacuoles.Nature. 451:350–354 - PubMed
    1. Brass A.L., Dykxhoorn D.M., Benita Y., Yan N., Engelman A., Xavier R.J., Lieberman J., Elledge S.J. 2008. Identification of host proteins required for HIV infection through a functional genomic screen.Science. 319:921–926 - PubMed

Publication types

MeSH terms

Substances