. 2009 Aug;134(2):95-113.
doi: 10.1085/jgp.200810158.

The external pore loop interacts with S6 and S3-S4 linker in domain 4 to assume an essential role in gating control and anticonvulsant action in the Na(+) channel

Affiliations

The external pore loop interacts with S6 and S3-S4 linker in domain 4 to assume an essential role in gating control and anticonvulsant action in the Na(+) channel

Ya-Chin Yang et al. J Gen Physiol. 2009 Aug.

Abstract

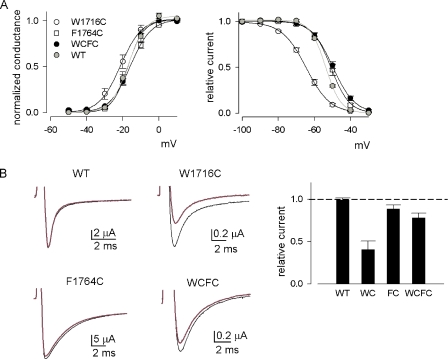
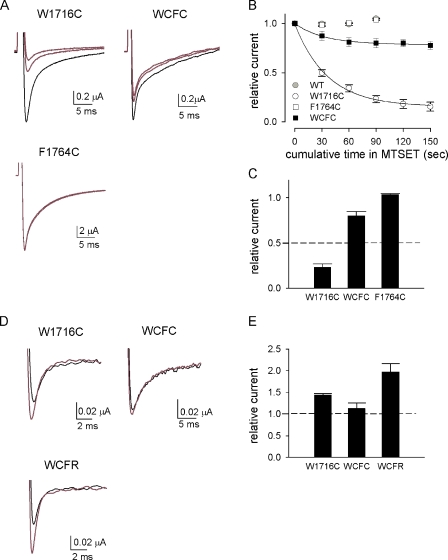
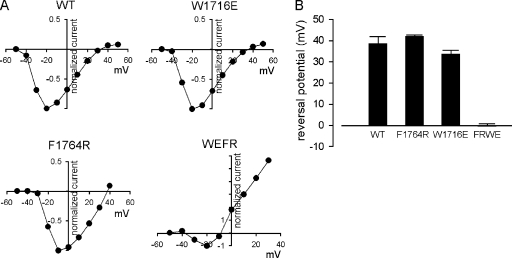
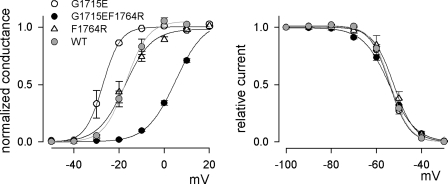
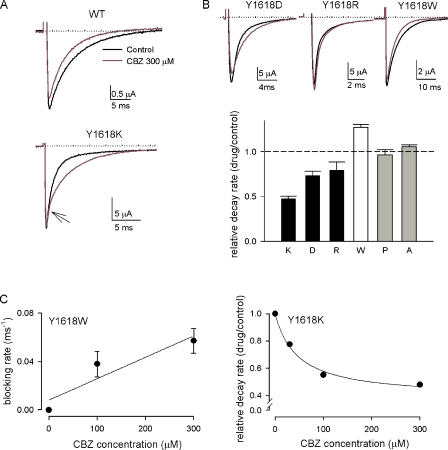
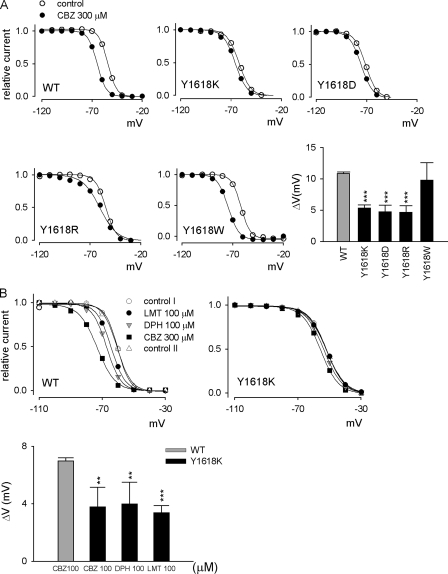
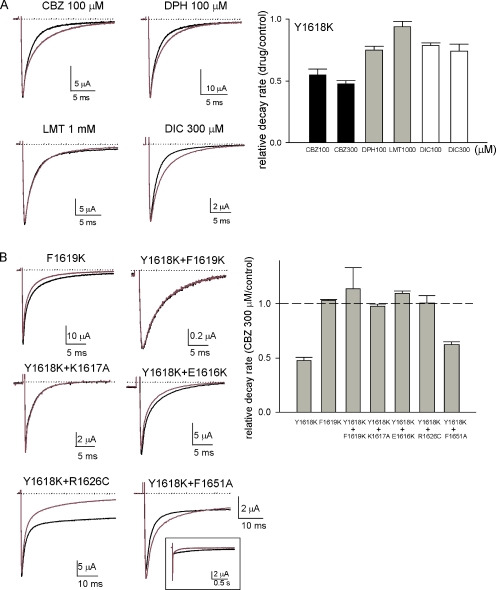
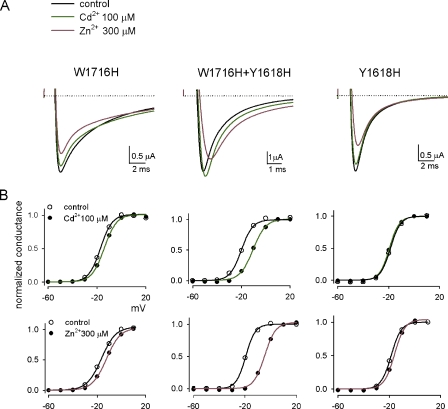
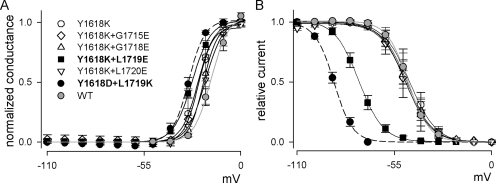
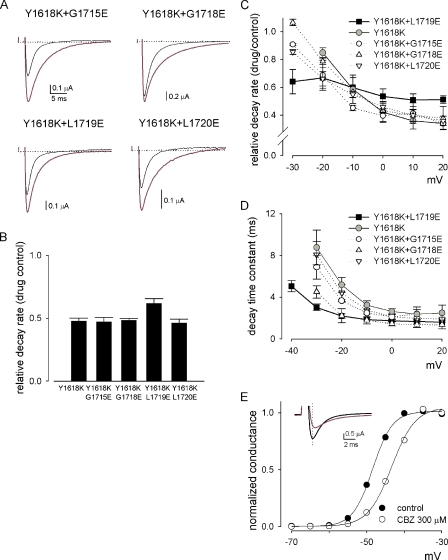
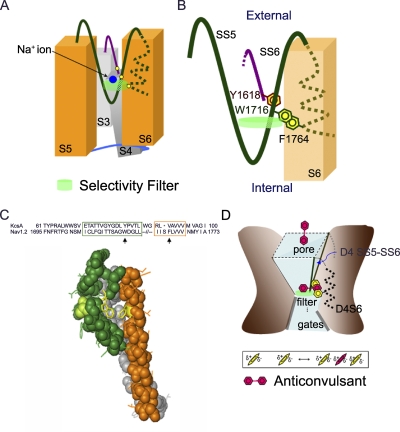
Carbamazepine, phenytoin, and lamotrigine are widely prescribed anticonvulsants in neurological clinics. These drugs bind to the same receptor site, probably with the diphenyl motif in their structure, to inhibit the Na(+) channel. However, the location of the drug receptor remains controversial. In this study, we demonstrate close proximity and potential interaction between an external aromatic residue (W1716 in the external pore loop) and an internal aromatic residue (F1764 in the pore-lining part of the sixth transmembrane segment, S6) of domain 4 (D4), both being closely related to anticonvulsant and/or local anesthetic binding to the Na(+) channel. Double-mutant cycle analysis reveals significant cooperativity between the two phenyl residues for anticonvulsant binding. Concomitant F1764C mutation evidently decreases the susceptibility of W1716C to external Cd(2+) and membrane-impermeable methanethiosulfonate reagents. Also, the W1716E/F1764R and G1715E/F1764R double mutations significantly alter the selectivity for Na(+) over K(+) and markedly shift the activation curve, respectively. W1716 and F1764 therefore very likely form a link connecting the outer and inner compartments of the Na(+) channel pore (in addition to the selectivity filter). Anticonvulsants and local anesthetics may well traverse this "S6 recess" without trespassing on the selectivity filter. Furthermore, we found that Y1618K, a point mutation in the S3-4 linker (the extracellular extension of D4S4), significantly alters the consequences of carbamazepine binding to the Na(+) channel. The effect of Y1618K mutation, however, is abolished by concomitant point mutations in the vicinity of Y1618, but not by those in the internally located inactivation machinery, supporting a direct local rather than a long-range allosteric action. Moreover, Y1618 could interact with D4 pore residues W1716 and L1719 to have a profound effect on both channel gating and anticonvulsant action. We conclude that there are direct interactions among the external S3-4 linker, the external pore loop, and the internal S6 segment in D4, making the external pore loop a pivotal point critically coordinating ion permeation, gating, and anticonvulsant binding in the Na(+) channel.


Figures

Figure 1.
Figure 1.
The gating curves and Cd2+ block in the W1716C/F1764C (WCFC) double-mutant and the corresponding single-mutant channels. (A) The activation curves (left) and the inactivation curves (right) were documented by the protocols described in Materials and methods. The duration of the inactivating pulse for plotting the inactivation curve is set at 5 s to facilitate comparison with the data (Table I) in the presence of drugs that have relatively slow binding kinetics. The findings remain qualitatively very similar with 100-ms inactivating pulses (not depicted). The curves in the left panel are fits with a Boltzmann function with V1/2 values (in mV) of −16.9, −21.3, −15.9, and −17.2 and k values of 4.9, 5.9, 5.7, and 4.4 for the wild-type (WT; the gray line, n = 6), W1716C (n = 6), F1764C (n = 17), and WCFC (n = 15) mutant channels, respectively. The curves in the right panel are fits with a Boltzmann function with V1/2 values (in mV) of −54.2, −64.6, −50.9, and −49.8 and k values of 4.6, 6.7, 5.1, and 6.1 for the WT (the gray line, n = 10), W1716C (n = 7), F1764C (n = 4), and WCFC (n = 14) mutant channels, respectively. (B) Cd2+ block of different mutant channels. The oocyte was held at −110 mV and stepped every 3 s to a test pulse of −20 mV for 100 ms. (Left) The elicited currents in the presence (red lines) and absence (black lines) of 100 μM Cd2+. (Right) The peak currents in the former are normalized to the peak current in the latter to give the relative current (n = 4–7).
Figure 2.
Figure 2.
The effect of external MTSET and MTSES on the wild-type, W1716C, F1764C, and W1716C/F1764C (WCFC) or W1716C/F1764R (WCFR) mutant channels. (A) The effect of external MTSET. (Left) The sample currents after 0- (black line), 60-, and 120-s (red lines) cumulative modification by MTSET are shown. The oocyte was initially held at −110 mV and stepped to −10 mV for 40 ms to elicit the control Na+ currents in ND-96 solution. The oocyte was then held at −35 mV and perfused with ND-96 containing 0.1 mM (for W1716C and WCFC mutant channels) or 1 mM (for wild-type and F1764C mutant channels) of freshly made MTSET for 30 s, after which the oocyte was held at −110 mV again and washed with control ND-96 for 30–60 s. The Na+ current after modification was assessed by a test pulse at −10 mV. This protocol was repeated until a steady state of MTSET modification was reached. We also repeated the same experimental protocols in the absence of MTS reagents and found no changes in the currents before and after the protocols (not depicted). (B) The relative currents are plotted against the cumulative time in MTSET (n = 3–4). The curves are relative current = 0.84 × exp(−t/36.2) + 0.16 and relative current = 0.22 × exp(−t/32.8) + 0.78 for the W1716C and WCFC mutant channels, respectively, where t denotes the cumulative time in MTSET in seconds. (C) Peak Na+ currents after 90-s MTSET modification is normalized to control currents to give the relative currents (n = 3–4). (D) The effect of external MTSES. The oocyte was held at −120 mV, perfused with control ND-96 solution or ND-96 solution containing 2 mM of freshly made MTSES, and stepped every 2 s to −10 mV for 100 ms to assess the Na+ currents. A steady-state effect of MTSES is usually reached within 40 s in these mutant channels (not depicted). The oocyte was then washed with control ND-96 for 30–60 s and stepped to −10 mV to measure the Na+ current. The Na+ currents after 0- (black line) and 40-s (red line) cumulative modification by MTSES are superimposed. (E) Peak Na+ currents after a 40-s MTSES modification are normalized to control currents to give the relative currents (n = 3–4).
Figure 3.
Figure 3.
The reversal potentials in the wild-type (WT), W1716E, F1764R, and W1716E/F1764R (WEFR) mutant channels. (A) The representative current–voltage plots. The oocytes expressing each of the four different channels were bathed in ND-96. The oocytes were held at −120 mV and stepped to a test pulse of −120 to +50 mV for 100 ms, and then returned to −120 mV. The pulse protocols were repeated every 3 s, and the peak current at each test pulse is normalized to the maximal current elicited and plotted against the test pulse voltage to give the current–voltage plots. (B) The averaged reversal potentials for the four different channels in A (n = 5–15).
Figure 4.
Figure 4.
The gating curves in the wild-type (WT), G1715E, F1764R, and G1715E/F1764R (GEFR) mutant channels. The activation (left) and inactivation curves (right; inactivating pulse duration = 5 s) were documented by the protocols described in Materials and methods. The data for the wild-type channel are from Fig. 1 A and shown as gray symbols with gray lines. The activation curves are fits with a Boltzmann function with V1/2 values (in mV) of −27.2, −17.5, and 4.9 and k values of 3.9, 5.9, and 6.4 for G1715E (n = 3), F1764R (n = 6), and GEFR (n = 7) mutant channels, respectively. The inactivation curves are fits with a Boltzmann function with V1/2 values (in mV) of −54.2, −52.3, and −54.2 and k values of 4.3, 4.6, and 5.8 for G1715E (n = 6), F1764R (n = 8), and GEFR (n = 6) mutant channels, respectively.
Figure 5.
Figure 5.
Carbamazepine action on the decay phase of macroscopic Na+ currents in different Y1618 mutant channels. (A) 300 μM carbamazepine (CBZ) slightly accelerates the decay of the macroscopic current in the wild-type (WT) channel but evidently slows current decay in the Y1618K mutant channel. The two superimposed traces show the representative currents elicited by a step depolarization to +10 mV from a holding potential of −120 mV in the absence (black line) and presence (red line) of 300 μM carbamazepine. The dotted line indicates zero current level. Note that in the Y1618K channel, the slowing of current decay is not discernible from the peak but only becomes evident later on (the arrow indicates an arbitrary “starting point” for the slowing of decay). (B; Top) The same experiments as those in A were repeated in different Y1618 mutant channels. 300 μM carbamazepine (red lines) slightly slows the macroscopic current decay in the Y1618D and Y1618R, yet accelerates the decay in the Y1618W channels. The dotted line indicates zero current level. (Bottom) The relative decay rate (the decay rate in 300 μM carbamazepine normalized to the decay rate in control) is compared among different Y1618 mutant (Y1618K, D, R, W, P, and A) channels (n = 3–9). The decay rate is obtained from the inverse of the time constant of the monoexponential fit to the current decay. (C) Estimation of carbamazepine binding rate to the open Y1618W mutant channels and binding affinity to the resting Y1618K mutant channels. (Left) The differences between the inverses of the current decay time constants in drug and in control are plotted against the concentration of carbamazepine in the Y1618W mutant channel (n = 3). The line is the linear regression fit to the data points of the form: blocking rate (s−1) = 0.177 × D + 8, where D is the concentration of carbamazepine in μM. The slope of the line (∼1.8 × 10⁵ M−1s−1) gives a rough estimate of the binding rate of carbamazepine to the open Y1618W channel. (Right) The relative decay rates of the Y1618K mutant channel are plotted against different concentrations of carbamazepine. The relative decay rates in 30, 100, and 300 μM carbamazepine are 0.78 ± 0.028, 0.55 ± 0.046, and 0.48 ± 0.023, respectively (n = 4–9). The error bars are omitted in the plot. The curve is the fit of the data points with a one-to-one binding function: relative decay rate = (1 + 0.38 × D/46.4)/(1 + D/46.4), where D is the concentration of carbamazepine in μM.
Figure 6.
Figure 6.
Comparison of the shift of the inactivation curve by carbamazepine and the other anticonvulsant drugs in the wild-type and different Y1618 mutant channels. The inactivating pulse duration was 9 s to make sure of steady-state binding of the anticonvulsants, which have relatively slow binding rates onto the channel. (A) Representative inactivation curves in different Y1618 mutant channels before (open circles) and after (closed circles) the application of 300 μM carbamazepine. The lines are fits with a Boltzmann function with V1/2 values (control vs. 300 μM carbamazepine) in mV of −54.4 versus −64.9, −62.2 versus −66.1, −71.5 versus −75.5, −54.7 versus −60.6, and −62.0 versus −74.6, and k values (control vs. carbamazepine) of 4.3 versus 4.5, 5.7 versus 5.7, 5.4 versus 5.7, 5.0 versus 8.3, and 4.5 versus 5.2 for the wild-type (WT), Y1618K, Y1618D, Y1618R, and Y1618W mutant channels, respectively. The shift (ΔV) of the inactivation curve is defined as the difference between the V1/2 values in 300 μM carbamazepine and the V1/2 value in control and is shown in the bar graph. Mutations Y1618K, Y1618D, and Y1618R, but not Y1618W, evidently decrease the shift of the inactivation curve by carbamazepine (n = 3–4). ***, P < 0.005 by Student’s t test (compared with the wild-type data). (B) The shift of the inactivation curve by phenytoin and lamotrigine in the Y1618K mutant channel. The top panels show two representative oocytes containing the wild-type channel (left) and the Y1618K mutant channel (right), respectively. In the Y1618K mutant channel, the leftward shift of the inactivation curve by 100 μM lamotrigine (LMT), 100 μM phenytoin (DPH), or 300 μM carbamazepine (CBZ) is evidently smaller than that in the wild-type channel. Two sets of control data (control I and II, respectively; open symbols) were obtained before and after drug application in each plot to show no voltage drift during this long experiment. The lines are fits with a Boltzmann function. The averaged shift (ΔV) of the inactivation curve by 100 μM lamotrigine, phenytoin, or carbamazepine is shown in the bar graph (n = 4–5). **, P < 0.05 and ***, P < 0.005 by Student’s t test (compared with the wild-type data with 100 μM carbamazepine).
Figure 7.
Figure 7.
Delicate effects of drug structure and local conformation around Y1618 on the slowing of the macroscopic current decay in the Y1618K mutant channel. (A) The experiments and plots are done in the Y1618K mutant channel with the same methods described in Fig. 5, except that different concentrations of different anticonvulsants were applied. The macroscopic currents recorded in the presence (red lines) and absence (black lines) of drugs are superimposed. The slowing effects on the macroscopic current decay by 100 μM carbamazepine, 100 μM phenytoin, and 300 μM diclofenac are discernible. However, lamotrigine, even at 1 mM, only has a negligible effect on the decay. The dotted line indicates zero current level. The relative decay rates (the decay rate in drug relative to that in control) in the Y1618K mutant channel are shown in the bar graph for different concentrations of different drugs (n = 3–9). (B) The effect of concomitant mutations of another residue in the D4S3-4 linker or in the D4S4-5 linker on the slowed macroscopic current decay by carbamazepine in the Y1618K mutant channel. The macroscopic currents recorded in the presence (red lines) and absence (black lines) of 300 μM carbamazepine are superimposed. In the F1619K single-mutant and the Y1618K plus F1619K, K1617A, E1616K, or R1626 double-mutant channels, 300 μM carbamazepine shows no slowing effect on the macroscopic current decay. On the other hand, in the Y1618K/F1651A double-mutant channel, carbamazepine still slows the development of the partially impaired inactivation (ascribable to F1651A mutation). In this case, however, carbamazepine still helps to stabilize inactivation and reduces the sustained current at the end of a prolonged depolarizing pulse (e.g., 2 s; the inset figure). The dotted line indicates zero current level. (Right) The macroscopic decay rate in 300 μM carbamazepine is normalized to that in control to obtain the relative decay rate in different mutant channels (n = 3–9).
Figure 8.
Figure 8.
The effect of external group IIB divalent cations on the Y1618H, W1716H, and Y1618H plus W1716H mutant channels. (A) The representative currents in the absence (solid black lines) and presence of 100 μM Cd2+ (green lines) and 300 μM Zn2+ (red lines) on the same oocyte. The oocyte was held at −120 mV and stepped to −10 mV to elicit Na+ currents. The pulse protocol was repeated every 3 s until a steady-state effect of Cd2+ or Zn2+ was reached. The effects of both Cd2+ and Zn2+ can be readily washed out with the control ND-96 solution, and the observed effect remains the same regardless of the order of Cd2+ and Zn2+ application. The dotted lines mark the zero current level. (B) The activation curves in the absence (open circles and solid black lines) and presence of 100 μM Cd2+ (top panels; closed circles and green lines) or 300 μM Zn2+ (bottom panels; closed circles and red lines) were done by the protocols described in Materials and methods. The lines are fits with a Boltzmann function with V1/2 values (control vs. Cd2+) in mV of −17.2 versus −14.2, −19.7 versus −10.6, and −18.6 versus −19.5, and k values (control vs. Cd2+) of 4.8 versus 5.0, 4.9 versus 5.3, and 3.9 versus 3.8, and V1/2 values (control vs. Zn2+) in mV of −16.5 versus −12.4, −19.5 versus −4.7, and −18.6 versus −16.0, and k values (control vs. Zn2+) of 5.9 versus 5.8, 3.7 versus 4.2, and 3.9 versus 4.0 for the W1716H, the Y1618H plus W1716H, and the Y1618H mutant channels, respectively. The averaged shift of the V1/2 of the activation curve by Cd2+ is 0.8 ± 0.2, 1.9 ± 1.0, and 8.2 ± 0.9 mV, and the averaged V1/2 shift by Zn2+ is 2.6 ± 1.1, 3.7 ± 2.0, and 10.7 ± 2.6 mV for the Y1618H, the W1716H, and the Y1618H plus W1716H mutant channels, respectively (n = 3–4).
Figure 9.
Figure 9.
Alterations in the activation and inactivation curves by the interaction between the countercharges introduced to Y1618 and the pore loop residues in domain 4. The averaged activation curves (A) and inactivation curves (B; the inactivating pulse duration = 100 ms) were done by the protocols described in Materials and methods (n = 3–5). The lines in the left panel are fits with a Boltzmann function with V1/2 values (in mV) of −24.5, −23.4, −21.4, −27.7, −20.5, and −29.7, and k values of 4.6, 4.2, 4.0, 5.2, 5.2, and 4.6 for Y1618K, Y1618K plus G1715E, Y1618K plus G1718E, Y1618K plus L1719E, Y1618K plus L1720E, and Y1618D plus L1719K mutant channels, respectively. The data for the wild-type channel are from Fig. 1 A. The lines in the right panel are fits with a Boltzmann function with V1/2 values (in mV) of −47.2, −46.1, −48.6, −47.8, −75.0, −48.5, and −89.1, and k values of 6.0, 7.3, 6.9, 6.8, 6.7, 7.0, and 5.3 for the wild-type, 1618K, Y1618K plus G1715E, Y1618K plus G1718E, Y1618K plus L1719E, Y1618K plus L1720E, and Y1618D plus L1719K mutant channels, respectively. We also did the inactivation curves with 9-s inactivating pulses and found that the inactivation curve is still leftward shifted by ∼30 mV in the Y1618K/L1719E double-mutant channel compared with the wild-type channel. The data for the wild-type channel are shown as gray circles with gray lines.
Figure 10.
Figure 10.
Carbamazepine action on the mutant channels containing Y1618K and glutamate substitutions for the pore loop residues in domain 4. (A) The two superimposed traces show the representative currents elicited from a holding potential of −120 mV to a test depolarization at 0 mV in the absence (black lines) and presence (red lines) of 300 μM carbamazepine. The dotted line indicates zero current level. (B) The macroscopic current decays in A are quantified by the methods in Fig. 1 D to give the relative decay rates for different mutant channels (n = 3–4). (C) The relative decay rates of the macroscopic currents (in 300 μM carbamazepine vs. in control) are examined at different test voltages and in different mutant channels (n = 3–4 for each different channel). Note the apparent lack of voltage dependence of the data from the Y1618K/L1719E double-mutant channel. (D) The decay time constants (in ms) of the macroscopic currents in control (i.e., without any drug) are plotted against different test voltages in different mutant channels (n = 4 for each different channel). The mutant channels in the figure all have significantly faster saturating inactivation kinetics than the wild-type channel. The decay time constants examined at +10 mV for the mutant channels are all ranged between 1.4 ± 0.26 and 2.4 ± 0.41 ms, and that for the wild-type channel (n = 9) is 4.1 ± 0.83 ms (P < 0.001 between any one mutant channel and the wild-type channel compared by Student’s t test). (E) Carbamazepine alters activation of the Y1618K plus L1719E double-mutant channel. The activation curves of the mutant channel were done by the protocols described in Materials and methods. The lines are fits of the data from the same oocyte with a Boltzmann function with V1/2 values (in mV) of −26.9 and −16.8, and k values of 5.1 and 6.1 in the absence (black circles) and presence (white circles) of 300 μM carbamazepine. The averaged shift of the V1/2 of the activation curve by 300 μM carbamazepine is 7.2 ± 2.6 mV (n = 3). The inset contains representative currents elicited by a step depolarization to −20 mV from a holding potential of −120 mV. The dotted vertical line marks the time point when the peak macroscopic current in control (black line) is reached. It is evident that 300 μM carbamazepine (red line) slows the macroscopic activation (rightward shifts the peak of macroscopic current) of the Y1618K plus L1719E mutant channel.
Figure 11.
Figure 11.
A model illustrating the close proximity and interactions among the S3-4 linker (e.g., Y1618), the SS6 pore loop (e.g., W1716), and the internal pore-lining part of S6 (e.g., F1764) in domain 4 of the Na+ channel, making a pivotal apparatus for ion permeation, activation-inactivation coupling, and drug binding. (A) The transmembrane segments S3–S6 in domain 4 of the channel are plotted as rectangular cylinders and viewed from the pore. W1716 is adjacent to A1714 in sequence, and thus is most likely located externally to the selectivity filter in the SS6 pore loop. This position could reasonably interact with F1764 of S6 if there is a turn at the junction of SS6 loop and S6 helix. As a result, the S6 helix in the vicinity of F1764 forms a “recess” of the pore. The aromatic residues Y1618, W1716, and F1764 are plotted as yellow dots. Membrane voltage changes move the S4 segment, and thus move the S3-4, S4-5, and S5-6 linkers to contribute to the essential voltage-dependent physiological and pharmacological attributes of the channel. (B) An enlarged picture for the interacting aromatic residues in A. (C) A homology model for the S6 recess of domain 4 in Nav1.2 based on the crystallized structure of the KcsA K+ channel pore (done by an online server provided by the Swiss Institute of Bioinformatics: http://swissmodel.expasy.org). Because of the marked difference in the length of the pore loops between these two types of channels, the homology modeling is based on somewhat arbitrary sequence alignment of the key conservative residues of D4SS6 and S6 (marked by green and orange rectangles, respectively) in the Nav1.2 channel and a subunit in the KcsA channel, with a large portion of pore loop in Nav1.2 deleted (top panel; note the sequence numbering and the arrows indicating W1716 and F1764). In the molecular model (bottom panel), the S5, S6, and S5-S6 linker of domain 4 are shown as space fills and colored gray, orange, and dark green, respectively. A1714 is in light green to mark the possible location of the selectivity filter. The aromatic side chains of W1716 in SS6 and F1764 in S6 are shown in yellow. A carbamazepine molecule could be well docked to a receptor constituted by W1716 and F1764 in the recess region of this model with the Discovery Studio software (Accelyrs Inc.; not depicted). (D) The brown-colored areas illustrate the other part of the channel protein surrounding the aqueous pore region (light blue), which is made by the four SS5-SS6 loops from the four domains (illustrated as the four “walls” making the external part of the pore). W1716 on the SS5-SS6 loop and F1764 on S6 (dotted helix; both residues depicted as yellow phenyl groups) of domain 4 interact to form a recess, which is more readily depicted with an angle of view roughly perpendicular to that in A and B. The anticonvulsant drug (shown as a pink diphenyl motif) presumably binds to its receptor located at the S6 recess with dipole-induced dipole interactions among the phenyl groups of the drug (pink), W1716 and F1764 (both in yellow; the boxed picture). A hydrophobic drug molecule of suitable conformation could even go through the S6 recess and thus traverse the pore without trespassing on the selectivity filter, embodying the long-proposed “hydrophobic” pathway of local anesthetic action on the Na+ channel.

Similar articles

Cited by

References

    1. Bean B.P. 1984. Nitrendipine block of cardiac calcium channels: high-affinity binding to the inactivated state.Proc. Natl. Acad. Sci. USA. 81:6388–6392 - PMC - PubMed
    1. Bean B.P., Cohen C.J., Tsien R.W. 1983. Lidocaine block of cardiac sodium channels.J. Gen. Physiol. 81:613–642 - PMC - PubMed
    1. Béinitah J.-P., Tomaselli G.F., Marban E. 1996. Adjacent pore-lining residues within sodium channels identified by paired cysteine mutagenesis.Proc. Natl. Acad. Sci. USA. 93:7392–7396 - PMC - PubMed
    1. Benzinger G.R., Kyle J.W., Blumenthal K.M., Hanck D.A. 1998. A specific interaction between the cardiac sodium channel and site-3 toxin anthopleurin B.J. Biol. Chem. 273:80–84 - PubMed
    1. Butterworth J.F., Strichartz G.R. 1990. Molecular mechanisms of local anesthesia: a review.Anesthesiology. 72:711–734 - PubMed

Publication types

MeSH terms