. 2009 Aug;134(2):137-50.
doi: 10.1085/jgp.200910232.

The 9-methyl group of retinal is essential for rapid Meta II decay and phototransduction quenching in red cones

Affiliations

The 9-methyl group of retinal is essential for rapid Meta II decay and phototransduction quenching in red cones

Maureen E Estevez et al. J Gen Physiol. 2009 Aug.

Abstract

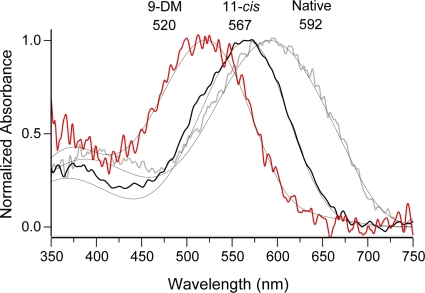
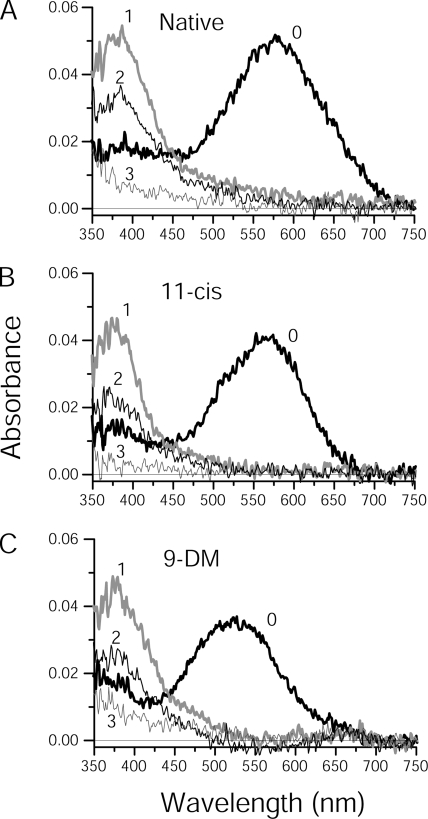
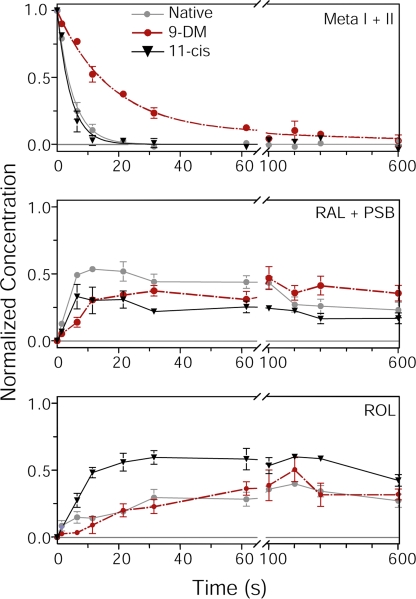
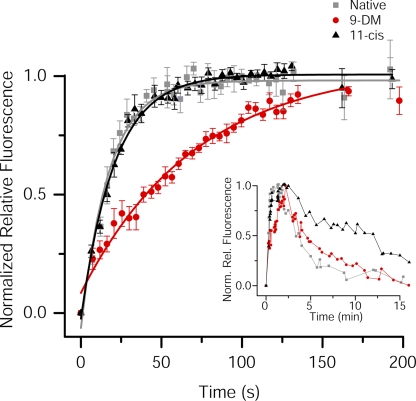
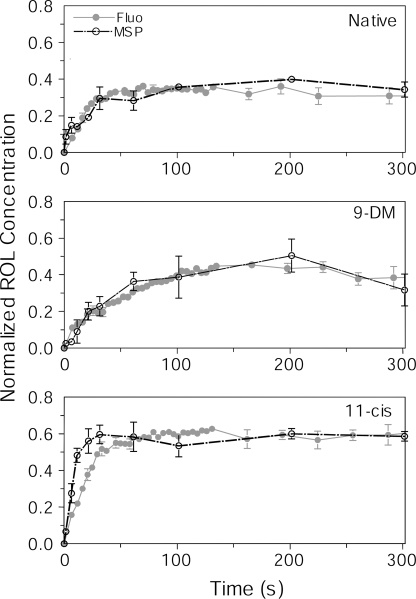
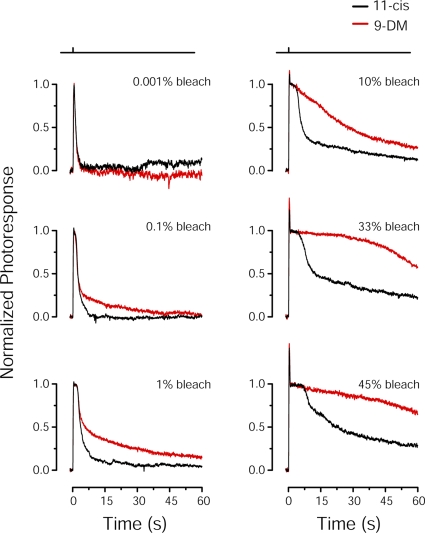
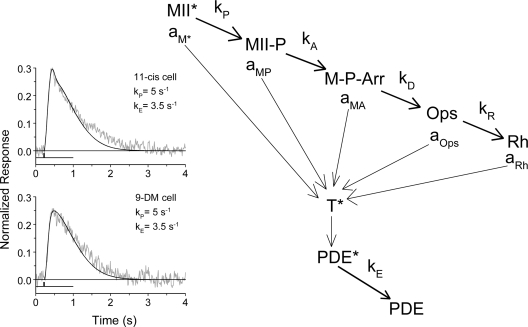
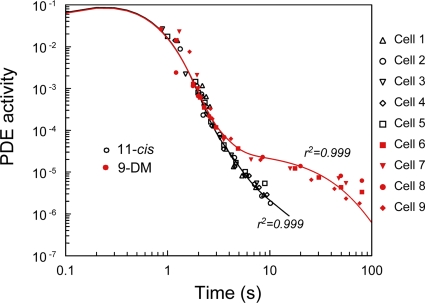
Cone photoreceptors of the vertebrate retina terminate their response to light much faster than rod photoreceptors. However, the molecular mechanisms underlying this rapid response termination in cones are poorly understood. The experiments presented here tested two related hypotheses: first, that the rapid decay rate of metarhodopsin (Meta) II in red-sensitive cones depends on interactions between the 9-methyl group of retinal and the opsin part of the pigment molecule, and second, that rapid Meta II decay is critical for rapid recovery from saturation of red-sensitive cones after exposure to bright light. Microspectrophotometric measurements of pigment photolysis, microfluorometric measurements of retinol production, and single-cell electrophysiological recordings of flash responses of salamander cones were performed to test these hypotheses. In all cases, cones were bleached and their visual pigment was regenerated with either 11-cis retinal or with 11-cis 9-demethyl retinal, an analogue of retinal lacking the 9-methyl group. Meta II decay was four to five times slower and subsequent retinol production was three to four times slower in red-sensitive cones lacking the 9-methyl group of retinal. This was accompanied by a significant slowing of the recovery from saturation in cones lacking the 9-methyl group after exposure to bright (>0.1% visual pigment photoactivated) but not dim light. A mathematical model of the turn-off process of phototransduction revealed that the slower recovery of photoresponse can be explained by slower Meta decay of 9-demethyl visual pigment. These results demonstrate that the 9-methyl group of retinal is required for steric chromophore-opsin interactions that favor both the rapid decay of Meta II and the rapid response recovery after exposure to bright light in red-sensitive cones.


Figures

Figure 1.
Figure 1.
Normalized absorbance spectra of Ambystoma mexicanum red cones containing different visual pigment chromophores. Averaged T-spectra of red cones in their native dark-adapted state (containing a mixture of A1 and A2 retinal [gray curve]; λmax = 592 nm; n = 11), red cones regenerated with 11-cis retinal (11-cis [black curve]; λmax = 567 nm; n = 11), or red cones regenerated with 9-DM retinal (red curve; λmax = 520 nm; n = 9). Smooth lines show corresponding template fittings. Native pigment is best approximated with a 30/70% mixture of A1/A2 chromophore (λmax = 567 and 615 nm, respectively). 11-cis–regenerated pigment is pure 567 nm A1. 9-DM spectrum can be represented by the sum of 93% 520-nm 11-cis A2 pigment and 7% of native 11-cis A2, 615 nm chromophore.
Figure 2.
Figure 2.
Series of post-bleach spectra of Ambystoma mexicanum red cones containing different visual pigment chromophores. Spectra were recorded at two polarizations (only T-polarizations are shown) and averaged from native red cones (A; n = 11), or red cones regenerated with either 11-cis retinal (B; n = 11) or 9-DM retinal (C; n = 9). After recording the dark spectra (curves labeled 0 in each case), a 1-s 525-nm flash was applied and post-bleach spectra were recorded immediately after the bleach (curves labeled 1 in each case) and at various time increments thereafter. Curves 2 represent recordings at either 5 s (A and B) or at 30 s (C) post-bleach and illustrate the approximate half-maximum MI + MII absorbance (peak at 380 nm). Curves 3 were recorded at 600 s post-bleach in all cases. Intermediate spectra recorded at 10, 20, 60, 100, 200, and 300 s post-bleach are excluded to avoid clutter.
Figure 3.
Figure 3.
The time course of bleaching products in Ambystoma mexicanum red cones containing different visual pigments as assessed by microspectrophotometry. The time course of metapigment decay (top; Meta I + II), the appearance of all-trans retinal and its protonated Schiff-bases (middle; RAL + PSB), and the formation of ROL (bottom) are plotted. Concentrations of bleaching products are expressed as a fraction of bleached visual pigment. Measurements were made from native red cones (gray; n = 11), or red cones regenerated either with 11-cis retinal (black; n = 11) or 9-DM retinal (red; n = 9). All curves were generated from the spectra shown in Fig. 2. The data in the top panel were fitted with a single-exponential decay function in the case of native and 11-cis pigments; however, a two-exponential approximation was required to fit the decay of 9-DM pigment. The data points in the middle and bottom panels were connected by straight lines. Note in the top panel, the time course of Meta decay in red cones containing 9-DM pigment (half-decay time τ1/2 = 14.1 s) is four to five times slower than in red cones containing native or 11-cis–regenerated pigment (τ1/2 = 3.5 and τ1/2 = 3 s, respectively). Error bars show ± SEM.
Figure 4.
Figure 4.
The time course of retinol formation in salamander red cones containing different visual pigments as assessed by microfluorometry. The normalized relative fluorescence intensity is plotted as a function of time after a >95% bleach in red cones from Ambystoma mexicanum under different visual pigment conditions. Data were normalized relative to the peak value and fitted with a single-exponential function. Red cones contained their native A1/A2 mixture (gray; n = 6; τ = 17.5 ± 1.2 s), or were regenerated with either 11-cis retinal (black; n = 5; τ = 20.8 ± 0.9 s) or 9-DM retinal (red; n = 6; τ = 70.9 ± 6.7 s). Error bars show ± SEM. Note that between the first and second measurements in all three cases, there is a rapid initial increase in fluorescence that is present in all fluorescence recordings; this has been reported previously (Tsina et al., 2004; Ala-Laurila et al., 2006) and is of unknown origin. The inset illustrates an experiment in which the rise and fall of retinol fluorescence were measured in a single red cone from Ambystoma tigrinum under all three visual pigment conditions. First, the red cone was measured with its native pigment (gray squares), then containing 9-DM retinal visual pigment (red circles), and finally containing 11-cis retinal visual pigment (black triangles). 100 µM IRBP was present to facilitate the exchange of chromophore. Data are normalized relative to the peak value.
Figure 5.
Figure 5.
A comparison of time courses of ROL production derived from microspectrophotometry versus microfluorometry. Data from Figs. 3 (bottom) and 4 have been replotted on the same graph for comparison. Data obtained by microspectrophotometry (MSP) are shown in black: n = 11 cells (native), 9 cells (9-DM), and 11 cells (11-cis). Fluorescence data are shown in gray: n = 6 cells (native), 6 cells (9-DM), and 5 cells (11-cis). Concentration of ROL in microspectrophotometry data are expressed as a fraction of bleached cone pigment. Fluorescence data are scaled for best visual match to microspectrophotometry. Error bars show ± SEM.
Figure 6.
Figure 6.
Flash response properties of Ambystoma mexicanum red cones containing different visual pigments. Shown are comparisons of average normalized flash responses to 500-ms test flashes that bleached various pigment fractions (pigment fraction shown in top right corner of each panel) in red cones. Cones were regenerated with 11-cis retinal (black traces; n = 6) or 9-DM retinal (red traces; n = 4). All traces have been smoothed by the Savitsky-Golay method (5 points to left and right). A significant difference in the photoresponse recovery between red and black traces is first observed at 0.1% bleach.
Figure 7.
Figure 7.
Kinetic scheme of quenching of the phototransduction cascade according to Firsov et al. (2005). The photoexcited visual pigment, MII*, is quenched in a series of reactions: the phosphorylation of MII* (formation of MII-P), subsequent arrestin binding (formation of M-P-Arr), decay of phosphorylated and arrestin-bound metaproducts to all-trans retinal and opsin (Ops), and eventual regeneration of the dark pigment (Rh). Each reaction is assumed to proceed accordingly to first-order kinetics with rate constants kP, kA, kD, and kR, respectively. GTPase (operating with rate constant kE) quenches the active transducin T*–PDE* complex. Fractional (with respect to fully active MII*) activities of the intermediates toward transducin are aM* = 1 > aMP > aMA > aOps > aRh. This is adapted from Firsov et al. (2005), with permission. (Insets) Cone responses to a dim 20-ms flash (noisy gray curves) with superimposed phototransduction model response (smooth black line) for regenerated 11-cis (top) and regenerated 9-DM (bottom) red cones. kP and kE were obtained from modeling. Light stimulus marks are shown below the curves.
Figure 8.
Figure 8.
Comparison of quenching of the phototransduction cascade in salamander red cones containing different visual pigments. Experimental points for 11-cis–regenerated cones are shown in black; those for 9-DM cones are in red. The solid line is drawn as a five-exponential least-square approximation with four free parameters. It yields the time course of quenching of flash-induced PDE activity for red cones of Ambystoma mexicanum containing 11-cis (black) or 9-DM (red) visual pigment, as follows from the theoretical prediction of the kinetic scheme of Fig. 7. Numbers near the curves show coefficient of determination of the model fits. The fits were further used to obtain the parameters of reactions given in Table I, as explained in the text.

Similar articles

Cited by

References

    1. Ala-Laurila P., Kolesnikov A.V., Crouch R.K., Tsina E., Shukolyukov S.A., Govardovskii V.I., Koutalos Y., Wiggert B., Estevez M.E., Cornwall M.C. 2006. Visual cycle: dependence of retinol production and removal on photoproduct decay and cell morphology.J. Gen. Physiol. 128:153–169 - PMC - PubMed
    1. Ala-Laurila P., Donner K., Crouch R.K., Cornwall M.C. 2007. Chromophore switch from 11-cis-dehydroretinal (A2) to 11-cis-retinal (A1) decreases dark noise in salamander red rods.J. Physiol. 585:57–74 - PMC - PubMed
    1. Buczylko J., Saari J.C., Crouch R.K., Palczewski K. 1996. Mechanisms of opsin activation.J. Biol. Chem. 271:20621–20630 - PubMed
    1. Burns M.E., Arshavsky V.Y. 2005. Beyond counting photons: trials and trends in vertebrate visual transduction.Neuron. 48:387–401 - PubMed
    1. Chen C., Tsina E., Cornwall M.C., Crouch R.K., Vijayaraghavan S., Koutalos Y. 2005. Reduction of all-trans retinal to all-trans retinol in the outer segments of frog and mouse rod photoreceptors.Biophys. J. 88:2278–2287 - PMC - PubMed

Publication types