. 2009 Aug 3;206(8):1673-80.
doi: 10.1084/jem.20082460. Epub 2009 Jul 27.

Omega-1, a glycoprotein secreted by Schistosoma mansoni eggs, drives Th2 responses

Affiliations

Omega-1, a glycoprotein secreted by Schistosoma mansoni eggs, drives Th2 responses

Bart Everts et al. J Exp Med. .

Abstract

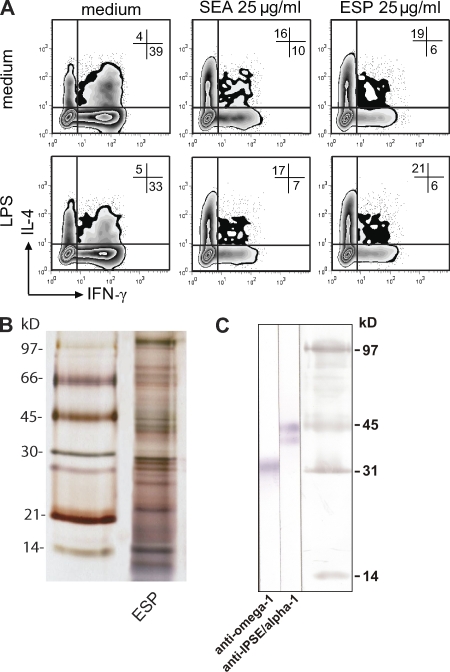
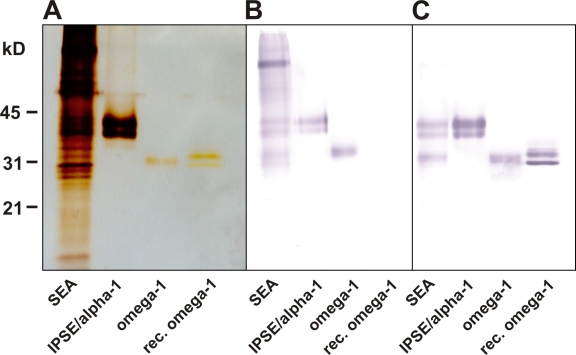
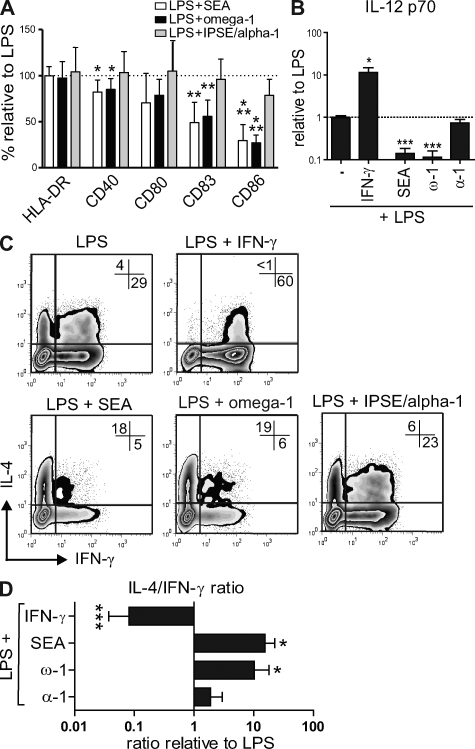
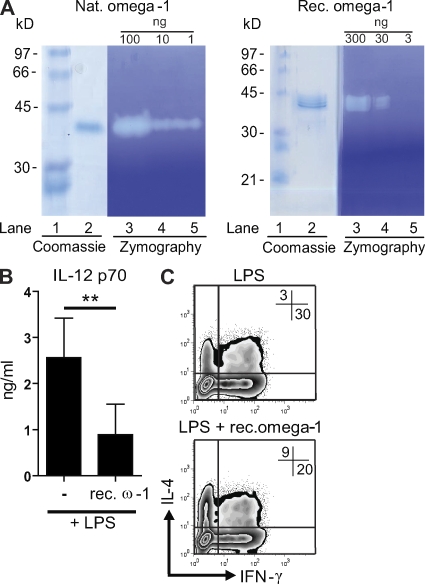
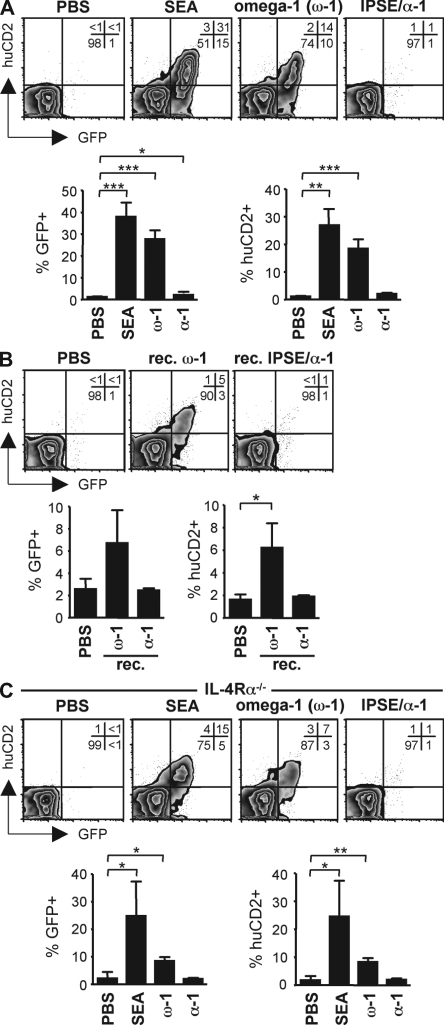
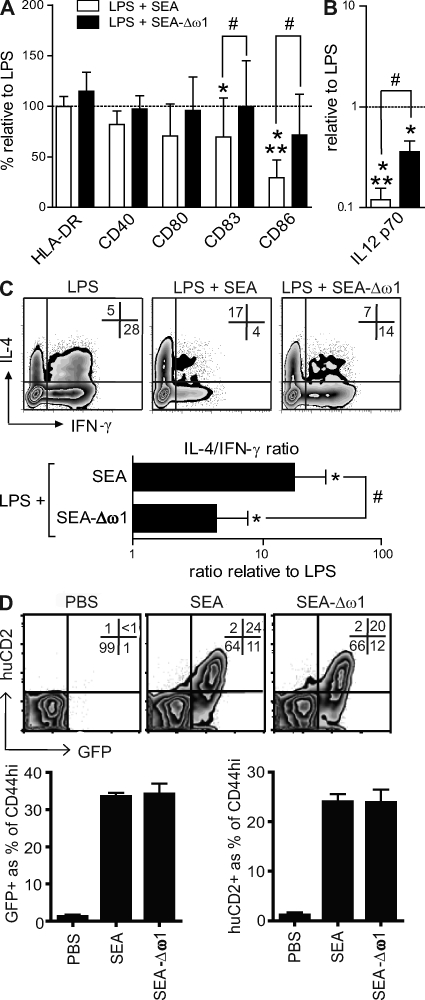
Soluble egg antigens of the parasitic helminth Schistosoma mansoni (S. mansoni egg antigen [SEA]) induce strong Th2 responses both in vitro and in vivo. However, the specific molecules that prime the development of Th2 responses have not been identified. We report that omega-1, a glycoprotein which is secreted from S. mansoni eggs and present in SEA, is capable of conditioning human monocyte-derived dendritic cells in vitro to drive T helper 2 (Th2) polarization with similar characteristics as whole SEA. Furthermore, using IL-4 dual reporter mice, we show that both natural and recombinant omega-1 alone are sufficient to generate Th2 responses in vivo, even in the absence of IL-4R signaling. Finally, omega-1-depleted SEA displays an impaired capacity for Th2 priming in vitro, but not in vivo, suggesting the existence of additional factors within SEA that can compensate for the omega-1-mediated effects. Collectively, we identify omega-1, a single component of SEA, as a potent inducer of Th2 responses.


Figures

Figure 1.
Figure 1.
Immunological and biochemical characterization of ESP from S. mansoni eggs. (A) Monocyte-derived DCs pulsed for 48 h with the different antigen preparations in the absence (top) or presence (bottom) of 100 ng/ml LPS as a maturation factor were co-cultured with allogeneic naive CD4+ T cells for 12 d in the presence of staphylococcal enterotoxin B and IL-2. Intracellular cytokine production was assayed by FACS 6 h after the stimulation of primed T cells with PMA and ionomycin. The frequencies of each population are indicated as percentages in the plot. One representative result from three independent experiments is shown. (B) 5 µg/cm ESP was separated under nonreducing conditions by SDS-PAGE and silver stained. (C) The presence of omega-1 and IPSE/alpha-1 was confirmed on Western blots by staining with specific anti–IPSE/alpha-1 and anti–omega-1 monoclonal antibodies.
Figure 2.
Figure 2.
SDS-PAGE of SEA, natural omega-1, and natural IPSE/alpha-1 as well as of recombinant omega-1 (silver staining and Western blotting). (A–C) 5 µg/cm SEA, 0.3 µg/cm omega-1, 0.3 µg/cm and IPSE/alpha-1 purified from SEA were separated by SDS-PAGE and silver stained or blotted onto nitrocellulose membrane. Silver staining (A) revealed a weak banding intensity of both natural and recombinant omega-1 compared with IPSE/alpha-1, although the purified proteins were applied to the gel at the same amounts (0.3 µg/cm). The two bands stained by anti-IPSE/alpha-1 represent posttranslational variants of the same protein (Schramm et al., 2003). On Western blots, alkaline phosphatase–labeled A. aurantia agglutinin (B) or a mixture of specific anti–IPSE/alpha-1 and anti–omega-1 monoclonal antibodies followed by alkaline phosphatase–labeled anti–mouse IgG secondary antibody (C) were used for detection. (B) Although A. aurantia agglutinin clearly binds to omega-1 and IPSE/alpha-1 as well as to a variety of other fucosylated components present in SEA, it does not bind to recombinant omega-1, whose glycans are lacking fucose residues (note that the double band of recombinant vs. natural omega-1 is caused by differential glycosylation). (C) In contrast, all purified proteins but no irrelevant SEA components are detected by the mixture of specific monoclonal antibodies.
Figure 3.
Figure 3.
Omega-1 modulates human DC maturation, cytokine production, and T cell–polarizing capacity with similar characteristics as SEA. (A) DCs were pulsed for 48 h with 25 µg/ml SEA, 500 ng/ml omega-1, or 500 ng/ml IPSE/alpha-1 in combination with 100 ng/ml LPS as a maturation factor, and surface expression of maturation markers was determined by FACS analysis. The expression levels, based on geometric mean fluorescence, of different maturation markers are shown relative to the DCs stimulated with LPS alone, which is set to 100% for each marker (dashed line). (B) DCs were co-cultured for 24 h with a CD40-L–expressing cell line, to mimic the interaction with T cells. IL-12p70 cytokine expression levels are shown relative to the DCs stimulated with LPS alone, which is set to 1 (dashed line). (C and D) T cell–polarizing capacity of the conditioned DCs was evaluated as described in legend for Fig. 1. (C) Representative plots out of at least four independent experiments are shown. (D) Based on intracellular cytokine staining, the ratio of T cells that were single positive for either IL-4 or IFN-γ was calculated relative to the control condition. Error bars in A, B, and D represent the mean ± SD of at least four independent experiments. *, P < 0.05; **, P < 0.01; ***, P < 0.001 for values significantly different from the LPS control, based on paired analysis (one-sided paired Student's t test). ω-1, omega-1; α-1, IPSE/alpha-1.
Figure 4.
Figure 4.
Recombinant omega-1 has RNase and Th2-polarizing activity similar to natural omega-1. (A) Recombinant omega-1 is a functional RNase as determined by negative-staining RNase zymography. Samples containing the indicated amount of protein were run under nondenaturing conditions on 11% SDS polyacrylamide gels containing 2 mg/ml of yeast RNA. Protein bands were detected by Coomassie blue staining (lane 2) or SDS was removed and RNase activity was detected by toluidine blue (lanes 3–5). Lane 1 contains molecular mass standards. (B) Monocyte-derived DCs were treated as described in the legend for Fig. 2. IL-12 p70 concentrations were determined by ELISA. Error bars represent the mean ± SD of four independent experiments. (C) T cell–polarizing capacity of the conditioned DCs was evaluated as described in legend for Fig. 1. One representative result from four independent experiments is shown. **, P < 0.01 (one-sided paired Student's t test). ω-1, omega-1.
Figure 5.
Figure 5.
Omega-1 is sufficient to drive Th2 polarization in vivo, independently of IL-4R signaling. (A) 4get/KN2 IL-4 dual reporter mice were injected s.c. with 20 µg SEA, 2 µg omega-1, or 2 µg IPSE/alpha-1 into the footpad. After 7 d, the frequency of GFP+ and huCD2+ within the CD4+CD44high effector T cell population was determined by flow cytometry in the draining popliteal lymph nodes. (B) 4get/KN2 mice were injected with recombinant proteins and analyzed as in A. (C) IL-4Rα−/− 4get/KN2 mice were treated and analyzed as in A. In all panels, representative plots are shown with the frequencies of each population indicated as percentages. Graphs depict the combined data of three to four individual mice per group and show one of at least two independent experiments. Error bars represent the mean ± SD. * P < 0.05; **, P < 0.01; ***, P < 0.001 for values significantly different from the PBS control (two-sided paired Student's t test).
Figure 6.
Figure 6.
Omega-1 is a major factor in SEA that conditions DCs for Th2 priming but not the only Th2-inducing component present in SEA. (A and B) Monocyte-derived DCs were pulsed for 48 h with 25 µg/ml SEA or 25 µg/ml omega-1–depleted SEA in combination with 100 ng/ml LPS and analyzed for surface expression of maturation markers and IL-12 production as described in the Fig. 2 legend. Error bars represent the mean ± SD of four independent experiments. (C) T cell–polarizing capacity of the conditioned DCs was evaluated as described in the Fig. 1 legend. Depicted are representative plots with percentages indicated. Based on intracellular cytokine staining, the ratio of T cells single positive for either IL-4 or IFN-γ was calculated relative to the control condition. Error bars represent the mean ± SD of five independent experiments. (D) 4get/KN2 mice were injected with recombinant proteins and analyzed as in Fig. 4. Depicted are representative plots with percentages indicated and the combined data of three individual mice per group of two independent experiments. * and #, P < 0.05; **, P < 0.01 for values significantly different from the controls (*) or SEA (#) based on paired analysis (one-sided paired Student's t test). ω-1, omega-1.

Similar articles

Cited by

References

    1. Cass C.L., Johnson J.R., Califf L.L., Xu T., Hernandez H.J., Stadecker M.J., Yates J.R., III, Williams D.L. 2007. Proteomic analysis of Schistosoma mansoni egg secretions.Mol. Biochem. Parasitol. 155:84–93 - PMC - PubMed
    1. Cervi L., MacDonald A.S., Kane C., Dzierszinski F., Pearce E.J. 2004. Cutting edge: dendritic cells copulsed with microbial and helminth antigens undergo modified maturation, segregate the antigens to distinct intracellular compartments, and concurrently induce microbe-specific Th1 and helminth-specific Th2 responses.J. Immunol. 172:2016–2020 - PubMed
    1. Cua D.J., Stohlman S.A. 1997. In vivo effects of T helper cell type 2 cytokines on macrophage antigen-presenting cell induction of T helper subsets.J. Immunol. 159:5834–5840 - PubMed
    1. de Jong E.C., Vieira P.L., Kalinski P., Schuitemaker J.H., Tanaka Y., Wierenga E.A., Yazdanbakhsh M., Kapsenberg M.L. 2002. Microbial compounds selectively induce Th1 cell-promoting or Th2 cell-promoting dendritic cells in vitro with diverse th cell-polarizing signals.J. Immunol. 168:1704–1709 - PubMed
    1. Donnelly S., Stack C.M., O'Neill S.M., Sayed A.A., Williams D.L., Dalton J.P. 2008. Helminth 2-Cys peroxiredoxin drives Th2 responses through a mechanism involving alternatively activated macrophages.FASEB J. 22:4022–4032 - PMC - PubMed

Publication types

MeSH terms