

TLR4-mediated signaling induces MMP9-dependent cleavage of B cell surface CD23
- PMID: 19635918
- PMCID: PMC2914506
- DOI: 10.4049/jimmunol.0803660
TLR4-mediated signaling induces MMP9-dependent cleavage of B cell surface CD23
Abstract
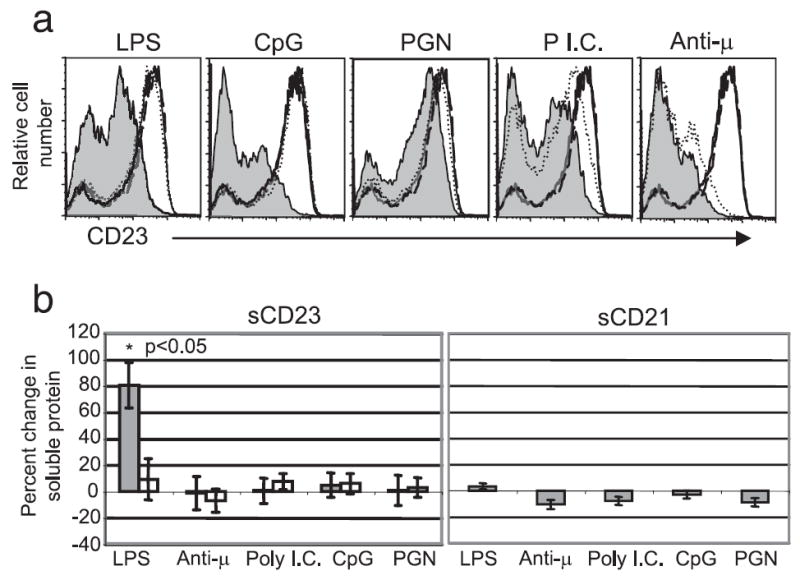
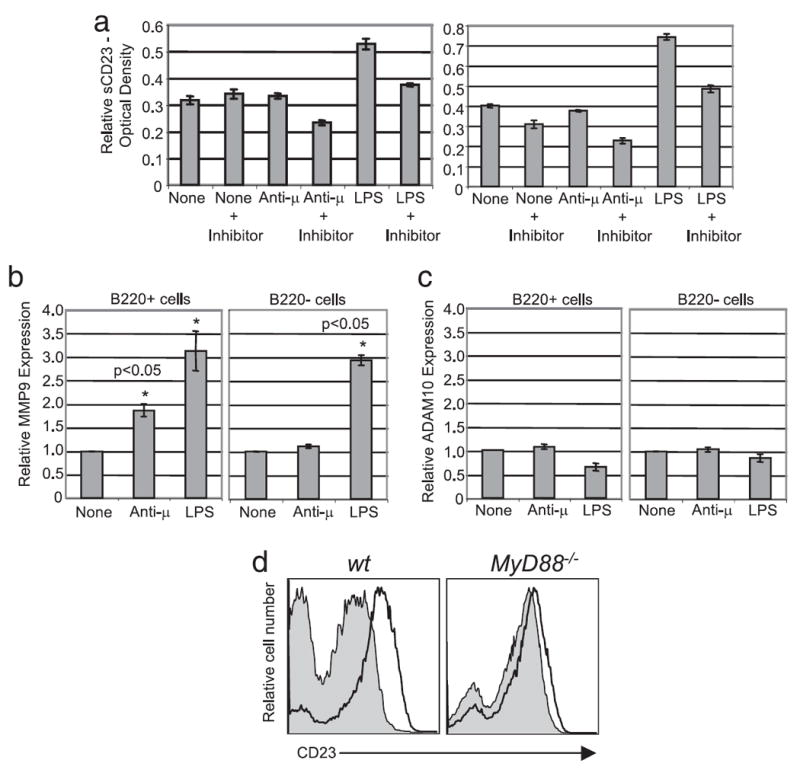
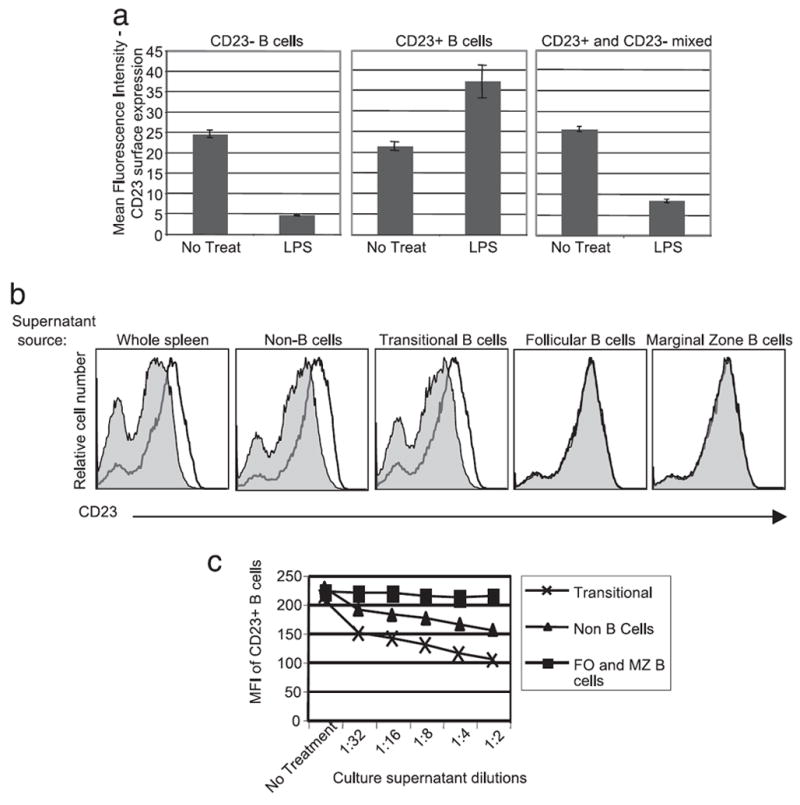
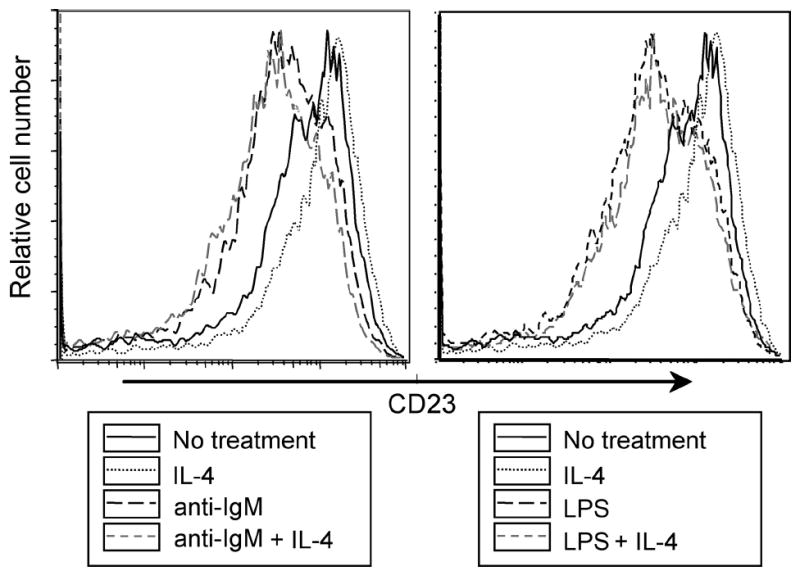
IgE production is inversely regulated by circulating and B cell surface levels of the low affinity IgE receptor, CD23. To begin to understand physiologic determinants of CD23 expression, we analyzed effects of BCR and TLR stimulation on CD23 levels. BCR and TLR 2, 3, 4, 6, and 9 agonists induced CD23 down-modulation from the cell surface. However, among the ligands only TLR4 agonists induced transcriptional activation of CD23 and generation of significant soluble CD23. These responses were induced by LPS both in vitro and in vivo, and were seen in both murine and human B cells. LPS also induced expression of matrix metalloprotease 9 (MMP9) and failed to induce CD23 cleaving activity in MMP9(-/-) cells, thus implicating MMP9 in the LPS-induced release of CD23 from the cell surface. Finally, type 1 transitional B cells uniquely produce MMP9 in response to LPS, suggesting a mechanism wherein endotoxin induces T1 cell expression of MMP9, which mediates cleavage of CD23 on distinct, mature B cells.
Conflict of interest statement
The authors have no financial conflict of interest.
Figures
 ) and MyD88−/− (□) splenic B cells 24 h after treatment with the indicated stimuli. Statistical significance was determined using the Wilcoxon signed-rank test. The p value was adjusted for multiple comparisons using the false discovery rate approach.
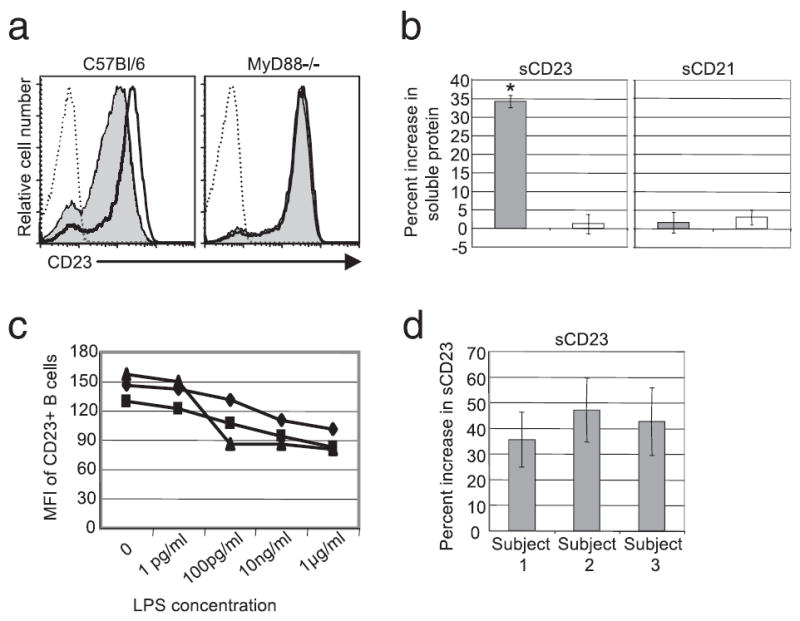 ) and MyD88−/− (□). c, Human peripheral blood from three patients (◆, patient 1; ▲, patient 2; ■, patient 3) was incubated in the presence of the indicated concentrations of LPS for 24 h. CD23 surface expression on B cells (CD19+) was determined by flow cytometry. d, Supernatants from the cells cultured with 10 ng/ml LPS in c were analyzed by ELISA as described in the Materials and Methods. Shown is the average percent increase in sCD23 in LPS treated cultures relative to unstimulated controls. Statistical significance was determined using the Wilcoxon signed-rank test. *, p < 0.05.
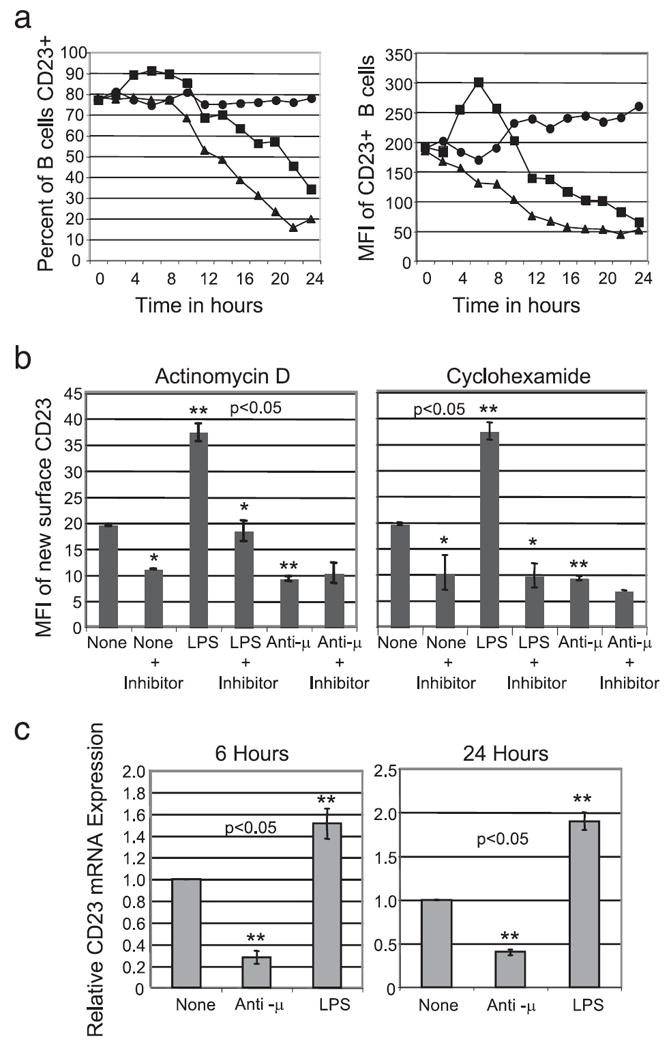
References
-
- Gould HJ, Sutton BJ, Beavil AJ, Beavil RL, McCloskey N, Coker HA, Fear D, Smurthwaite L. The biology of IGE and the basis of allergic disease. Annu Rev Immunol. 2003;21:579–628. - PubMed
-
- Fremeaux-Bacchi V, Fischer E, Lecoanet-Henchoz S, Mani JC, Bonnefoy JY, Kazatchkine MD. Soluble CD21 (sCD21) forms biologically active complexes with CD23: sCD21 is present in normal plasma as a complex with trimeric CD23 and inhibits soluble CD23-induced IgE synthesis by B cells. Int Immunol. 1998;10:1459–1466. - PubMed
-
- Ford JW, Kilmon MA, Haas KM, Shelburne AE, Chan-Li Y, Conrad DH. In vivo murine CD23 destabilization enhances CD23 shedding and IgE synthesis. Cell Immunol. 2006;243:107–117. - PubMed
-
- Gagro A, Rabatic S. Allergen-induced CD23 on CD4+ T lymphocytes and CD21 on B lymphocytes in patients with allergic asthma: evidence and regulation. Eur J Immunol. 1994;24:1109–1114. - PubMed
Publication types
MeSH terms
Substances
Grants and funding
LinkOut - more resources
Full Text Sources
Molecular Biology Databases
Miscellaneous
