Comparative Study
. 2009 Aug 11;120(6):467-76.
doi: 10.1161/CIRCULATIONAHA.108.825091. Epub 2009 Jul 27.

Termination of atrial fibrillation using pulsed low-energy far-field stimulation

Affiliations
Comparative Study

Termination of atrial fibrillation using pulsed low-energy far-field stimulation

Flavio H Fenton et al. Circulation. .

Abstract

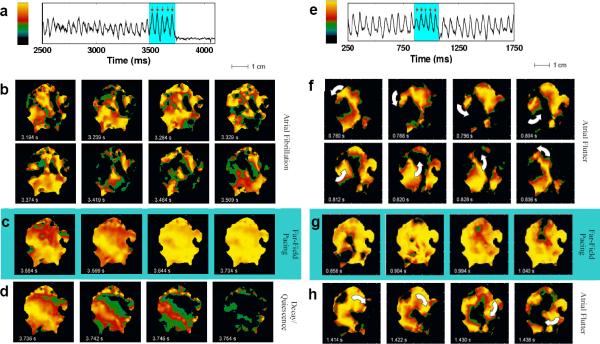
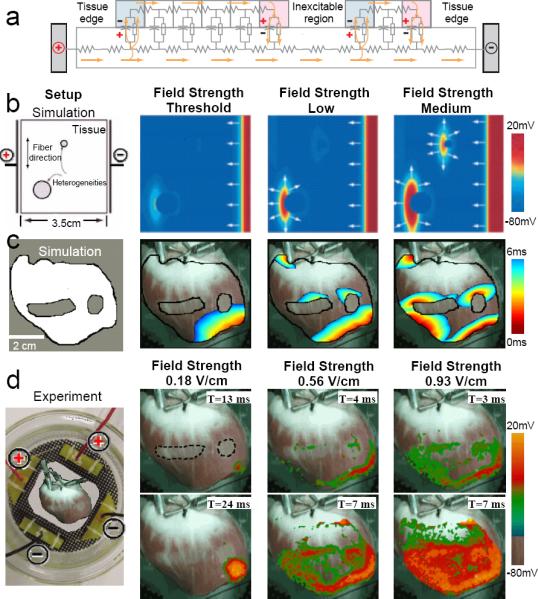
Background: Electrically based therapies for terminating atrial fibrillation (AF) currently fall into 2 categories: antitachycardia pacing and cardioversion. Antitachycardia pacing uses low-intensity pacing stimuli delivered via a single electrode and is effective for terminating slower tachycardias but is less effective for treating AF. In contrast, cardioversion uses a single high-voltage shock to terminate AF reliably, but the voltages required produce undesirable side effects, including tissue damage and pain. We propose a new method to terminate AF called far-field antifibrillation pacing, which delivers a short train of low-intensity electric pulses at the frequency of antitachycardia pacing but from field electrodes. Prior theoretical work has suggested that this approach can create a large number of activation sites ("virtual" electrodes) that emit propagating waves within the tissue without implanting physical electrodes and thereby may be more effective than point-source stimulation.

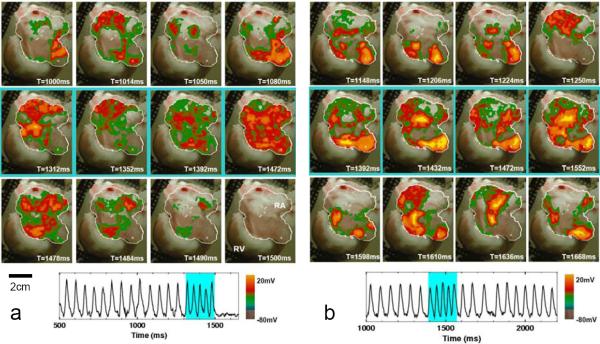
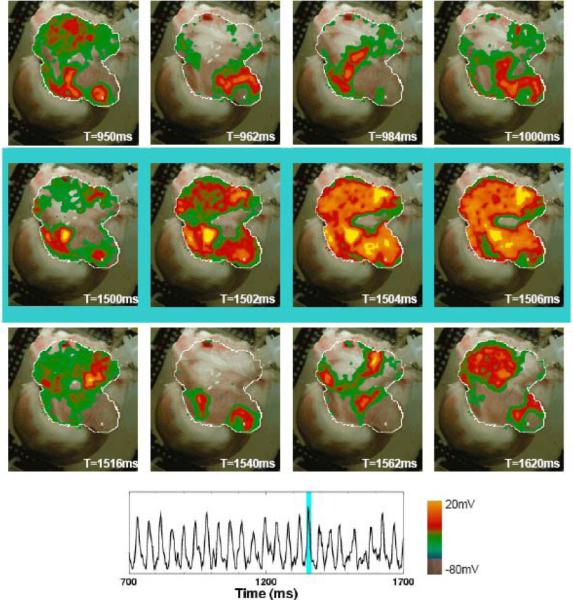
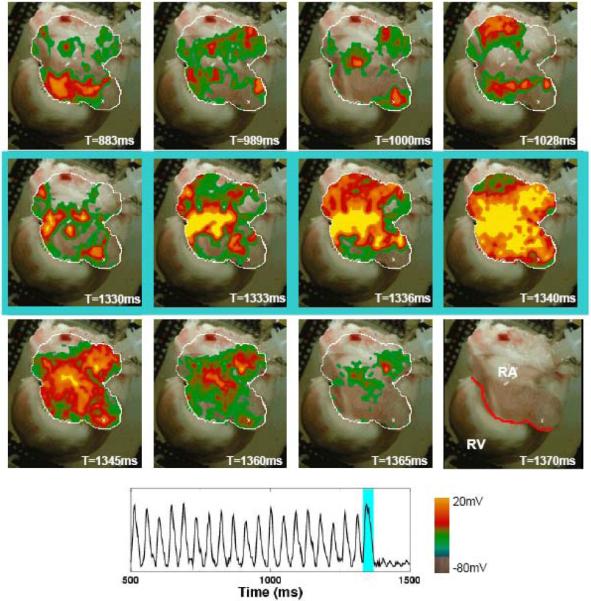
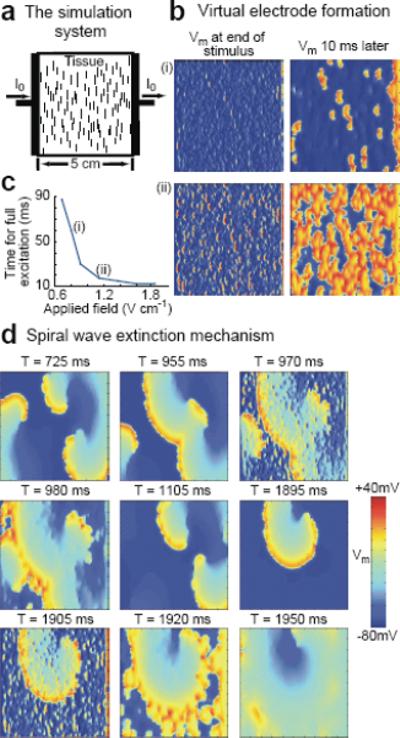
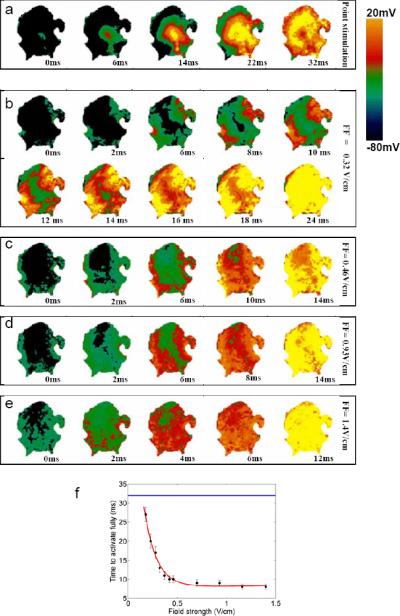
Methods and results: Using optical mapping in isolated perfused canine atrial preparations, we show that a series of pulses at low field strength (0.9 to 1.4 V/cm) is sufficient to entrain and subsequently extinguish AF with a success rate of 93% (69 of 74 trials in 8 preparations). We further demonstrate that the mechanism behind far-field antifibrillation pacing success is the generation of wave emission sites within the tissue by the applied electric field, which entrains the tissue as the field is pulsed.

Conclusions: AF in our model can be terminated by far-field antifibrillation pacing with only 13% of the energy required for cardioversion. Further studies are needed to determine whether this marked reduction in energy can increase the effectiveness and safety of terminating atrial tachyarrhythmias clinically.


Figures

Figure 1
Figure 1
Successful and unsuccessful termination of AF. a. Optical signal from one pixel during AF showing successful defibrillation after delivery of five far-field pulses of 1.4 V/cm at a cycle length of 45 ms (red arrows). b. Optical signal during fibrillation; color represents voltage (see color bar in panel a). Frames are 45 ms apart in time and show the complex wave patterns during fibrillation. c. Effects of shocks #1, 2, 3 and 5 (left to right), with the first two panels showing partial capture and the last two showing global capture. d. Evolution to full repolarization and quiescence following shock #5. e. Optical signal from one pixel during atrial flutter showing unsuccessful defibrillation after five field pulses of 0.9V/cm at a cycle length of 45 ms (red arrows). f. Optical signal showing a spiral wave rotating counter-clockwise before the shocks. g. Partial capture by shocks #1, 2, 4 and 5 (left to right). h. Shock-induced conversion of the original spiral wave into a spiral wave rotating clockwise. Throughout, light blue shading indicates time during applied shocks.
Figure 2
Figure 2
Successful and unsuccessful termination of atrial fibrillation. a. Successful termination. Top row: AF (dominant period = 59 ms) preceding FF-AFP. Middle row: shocks #1, 2, 3, and 5 in a series of 5 electric field pulses 40 ms apart (1.63 V/cm, 5 ms duration). Tissue area captured progressively increases. Bottom row: return to quiescence following the last pulse. Trace shows optical signal from one pixel (white cross in the above panels, lower right) before, during, and after FF-AFP. Light blue shading indicates time during applied shocks. b. Unsuccessful termination. Top row: AF (dominant period = 60 ms) preceding FF-AFP. Middle row: shocks #1, 3, 4, and 5 in a series of 5 electric field pulses 40 ms apart (1.40 V/cm, 5 ms duration). Not enough tissue is captured by the last pulse to terminate the arrhythmia. Bottom row: return to AF. Trace shows optical signal from one pixel (white cross in the above panels, lower right) before, during, and after FF-AFP. Light blue shading indicates time during applied shocks.
Figure 3
Figure 3
Unsuccessful termination of AF using a single high-voltage pulse. Top row shows AF preceding application of a single electric field pulse (4.67 V/cm, 5 ms duration), which fails to capture the entire tissue (middle row). Bottom row shows the return to arrhythmia following the pulse. Trace shows optical signal from one pixel (white cross in the above panels, lower right) before, during, and after FF-AFP. Light blue shading indicates time during applied shock. (2 μM ACh).
Figure 4
Figure 4
Successful termination of AF using a single high-voltage pulse. Top row shows AF preceding application of a single electric field pulse (3.73 V/cm, 10 ms duration), which successfully captures the entire tissue (middle row). Bottom row shows quiescence following the pulse. Trace shows optical signal from one pixel (white cross in the above panels, lower right) before, during, and after FF-AFP. The last panel indicates tissue geometry, with the red line separating the right atrium from the right ventricle. Light blue shading indicates time during applied shock. Same preparation as Figure 3 (2 μM ACh).
Figure 5
Figure 5
Mechanism of activation site formation. a. Schematic circuit representation of cardiac tissue with an inexcitable obstacle using the bidomain model. Current injected by the positive electrode produces regions of hyperpolarization (blue) and depolarization (red). b. Idealized simulated cardiac tissue with conductivity discontinuities created by two inexcitable obstacles. With increasing field strengths, first the tissue edge, then a single conductivity discontinuity, and finally both conductivity discontinuities are excited. Spatial resolution is 250 μm. c. Realistic simulated cardiac tissue with two inexcitable obstacles. As in b, increasing the field strength recruits more conductivity discontinuities as virtual electrodes. Spatial resolution is 100 μm. d. Experimental preparation with two inexcitable obstacles created by cryoablation shown with a dotted line (geometry as in c). Increased field strengths progressively activate more tissue.
Figure 6
Figure 6
Simulation of virtual electrode formation and termination of reentry in tissue with multiple small conductivity discontinuities. a. Tissue setup schematic. Pacing stimuli are delivered to a square sheet of cardiac tissue by injecting current from the left planar electrode. Collagenous septa (short vertical lines), randomly distributed throughout the tissue, serve as conductivity discontinuities around which induced activations form in response to the applied stimuli. Septa sizes are increased 10 times and only one of every 32 is shown for clarity. Spatial resolution is 250 μm. b. Membrane potential Vm induced in the tissue by field strengths of (i) 0.8 V/cm and (ii) 1.14 V/cm (5 ms, square wave pulse). c. Time required for a single applied stimulus of various field strengths to depolarize the entire tissue from the resting state. d. Termination of reentry by eight low-voltage shocks at a cycle length corresponding to the spiral wave period. Membrane potential is shown before and after shocks #3 and 8 (S3 and S8, delivered at T= 970 ms and T= 1905 ms, respectively).
Figure 7
Figure 7
Recruitment of activation sites as a function of field strength in atrial tissue. a. Propagation induced by stimulation using a point electrode. b-e. Activation of tissue by field stimulation at field strengths of 0.32, 0.46, 0.93, and 1.4 Vcm. As field strength is increased, more virtual electrodes are recruited, resulting in more rapid depolarization of the entire tissue. f. Time to full activation of the tissue as a function of electric field strength. Blue line represents time to full activation from a point stimulus.

Similar articles

Cited by

References

    1. Waktare JE. Cardiology patient page. Atrial fibrillation. Circulation. 2002;106:14–16. - PubMed
    1. Heart Disease and Stroke Statistics—2007 Update. Circulation. 2007;115:e69–e171. - PubMed
    1. Nattel S, Opie LH. Controversies in atrial fibrillation. Lancet. 2006;367:262–272. - PubMed
    1. Wijffels M, Kirchhof C, Dorland R, Allessie MA. Atrial fibrillation begets atrial fibrillation: a study in awake chronically instrumented goats. Circulation. 1995;92:1954–1968. - PubMed
    1. Ideker RE, Zhou X, Knisley SB. Correlation among fibrillation, defibrillation, and cardiac pacing. Pacing Clin Electrophysiol. 1995;18:512–525. - PubMed

Publication types