. 2009 Jul;7(7):e1000159.
doi: 10.1371/journal.pbio.1000159. Epub 2009 Jul 28.

Natural killer cell signal integration balances synapse symmetry and migration

Affiliations

Natural killer cell signal integration balances synapse symmetry and migration

Fiona J Culley et al. PLoS Biol. 2009 Jul.

Abstract

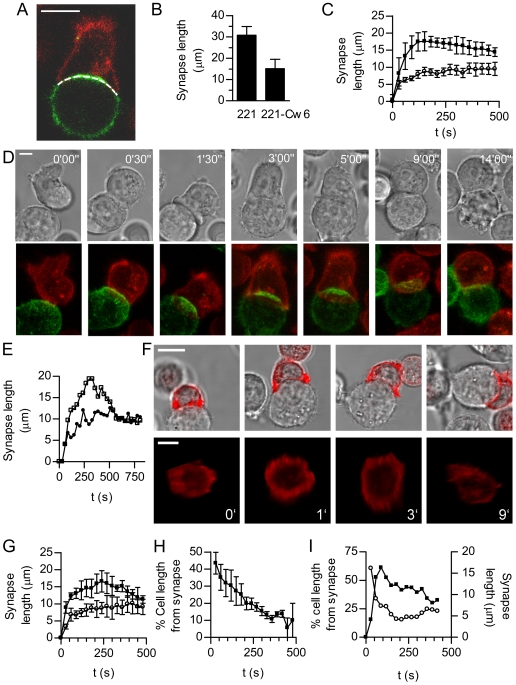
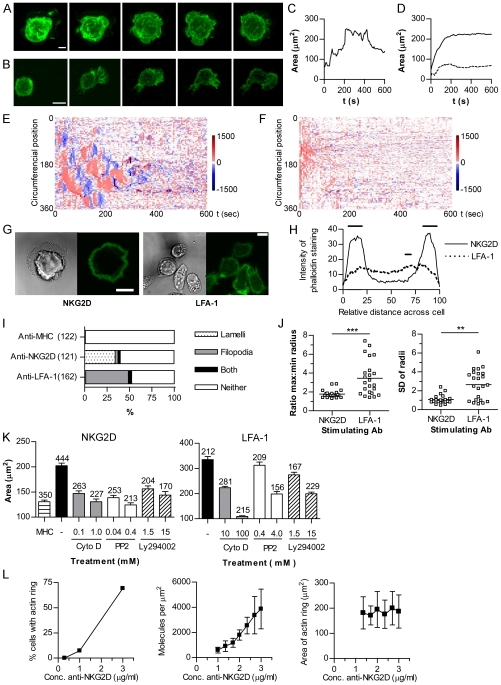
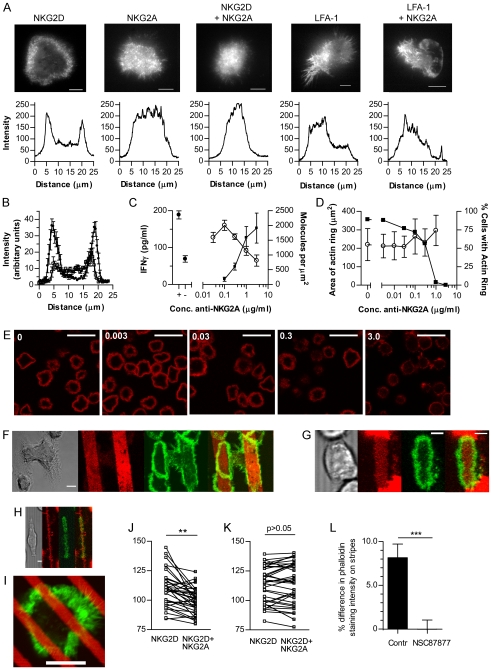
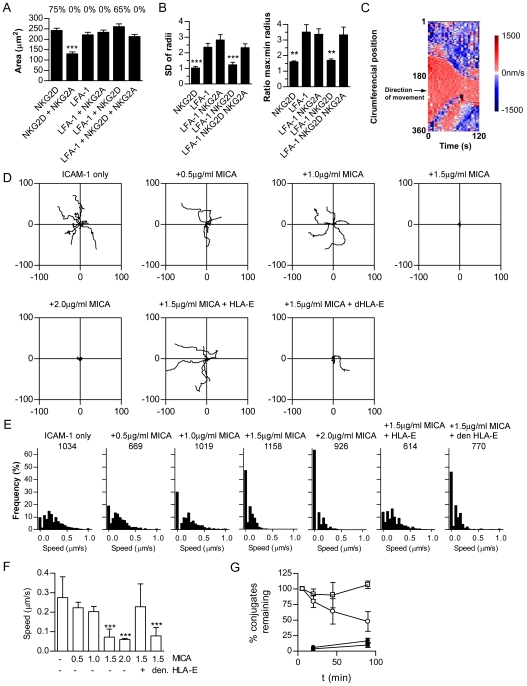
Natural killer (NK) cells discern the health of other cells by recognising the balance of activating and inhibitory ligands expressed by each target cell. However, how the integration of activating and inhibitory signals relates to formation of the NK cell immune synapse remains a central question in our understanding of NK cell recognition. Here we report that ligation of LFA-1 on NK cells induced asymmetrical cell spreading and migration. In contrast, ligation of the activating receptor NKG2D induced symmetrical spreading of ruffled lamellipodia encompassing a dynamic ring of f-actin, concurrent with polarization towards a target cell and a "stop" signal. Ligation of both LFA-1 and NKG2D together resulted in symmetrical spreading but co-ligation of inhibitory receptors reverted NK cells to an asymmetrical migratory configuration leading to inhibitory synapses being smaller and more rapidly disassembled. Using micropatterned activating and inhibitory ligands, signals were found to be continuously and locally integrated during spreading. Together, these data demonstrate that NK cells spread to form large, stable, symmetrical synapses if activating signals dominate, whereas asymmetrical migratory "kinapses" are favoured if inhibitory signals dominate. This clarifies how the integration of activating and inhibitory receptor signals is translated to an appropriate NK cell response.


Conflict of interest statement

The authors have declared that no competing interests exist.

Figures

Figure 1
Figure 1. The NK cell spreading and contraction response.
(A) An illustrative optical slice through a conjugate between a DiO-labelled NK cell (red) and a transfectant of 221 expressing MICA-YFP (green). The dotted line illustrates the length of contact measured. Scale bar  = 10 µm. (B) The synapse length (mean + SD) at activating synapses between YTS/KIR2DL1 and 221 target cells (n = 6) or inhibitory synapses between YTS/KIR2DL1 and 221/Cw6 (n = 13). (C) The size of activating synapses (mean±SD) between YTS/KIR2DL1 and 221 (n = 9, squares), and inhibitory synapses between YTS/KIR2DL1 and 221/Cw6 (n = 7, circles). (D) Time-lapse microscopy of NKL (red) spreading and contracting on a 221 cell expressing MICA-YFP (green). Images shown are maximal projections of fluorescent images and corresponding bright field images. Time as indicated, scale bar  =  5 µm. (E) The synapse length for the cell shown in (D) (squares) and a representative inhibitory synapse between an NKL cell and a 221-HLA-E (circles). (F) Time-lapse microscopy of NKL expressing actin-YFP and a 221 cell is shown as bright field images, overlaid with YFP-actin (red) and as an en face view of actin-YFP at the synapse. Times indicated relative to first image, scale bars  =  10 µm. (G) The length of synapse (mean±SD) for NKL cells and 221 expressing MICA-YFP (activating synapse; n = 5, squares) or 221 expressing HLA-E (inhibitory synapse; n = 7, circles). (H) Polarisation in NKL cells with 221-MICA, expressed as the distance of the 3-D centroid of intracellular membrane vesicles stained with DiD from the centre of the synapse relative to the length of the cell (mean±SEM; n = 7). (I) Measurement of synapse length (solid squares) reveals the spreading and contraction between a primary NK cell and 221 target cell. The distance of intracellular membranes from the synapse (open circles) highlights the simultaneous cell polarisation towards the target cell. Data are from a single conjugate, representative of 15.
Figure 2
Figure 2. NKG2D and LFA-1 ligation trigger morphologically different responses in NK cells.
Maximal intensity projections of YFP-mem NKL on (A) anti-NKG2D (scale  =  10 µm) or (B) anti-LFA-1 coated slides (scale  =  5 µm). Stacks (left to right) taken every minute from first contact with the slide. (C) Contact area of a single representative NKL cell spreading and contracting on anti-NKG2D, determined by confocal microscopy (images taken every 5 s). (D) Area of spreading of NKL cells on anti-LFA-1, untreated (solid line) or treated with sodium azide (dotted line). (E) The rate (nm/s) of extension or contraction of a YFP-mem NKL cell on anti-NKG2D, determined every 5 s. Extension away from the cell centre is coloured red and contraction in blue for each point around the circumference (y-axis) against time (x-axis). (F) Rate of extension or contraction of an NKL cell on anti-LFA-1. (G) F-actin (phalloidin-488; green), with corresponding bright field images for NKL cells on anti-NKG2D- or anti-LFA-1-coated slides. Scale  =  5 µm. (H) Quantification of f-actin (phalloidin-AlexaFluor633) across the diameter of cells stimulated on anti-NKG2D (solid line) or anti-LFA-1 (dotted line) (horizontal bars indicate p<0.05 by ANOVA, n = 20). (I) Morphology of cells stimulated with anti-LFA-1, anti-NKG2D, or anti-MHC I. Number of cells in brackets. (J) The distance from the centroid of phalloidin-AlexaFluor633-stained cells to the circumference was measured at 360 radii. Cell symmetry is represented as SD of the radial distances and the ratio of maximum and minimum lengths (**, p<0.01; ***, p<0.001; n = 20). (K) Spreading area (mean±SEM, n above each bar) of cells pretreated with cytochalasin, PP2, or LY294002, on anti-NKG2D, anti-LFA-1, or control untreated cells on anti-MHC I. (L) The density of antibody on the slide (n = 4±SD), the proportion of NKL cells responding by the formation of an actin ring and the area of spreading of cells forming an actin ring (mean±SD; n = 120–250) at a range of concentrations of anti-NKG2D.
Figure 3
Figure 3. Activating and inhibitory signal integration during the spreading response.
(A) TIRF microscopy of NKL YFP-actin on slides coated with anti-NKG2D, anti-NKG2A, and anti-LFA-1, or combinations thereof. Scale bar  =  10 µm. Lower panels: Fluorescence intensity through a cross section of each cell. (B) Intensity of f-actin (phalloidin-AlexaFluor633) across the diameter of NKL cells on anti-NKG2D (circles) or anti-NKG2D with anti-NKG2A (squares) (mean±SEM; n = 8). (C) IFNγ secretion by NKL on anti-NKG2D with anti-NKG2A (at concentrations indicated) and isotype-matched control mAb to maintain the same total concentration of Ab. For the minimal and maximal range of secretion (closed circles) the level of secretion with anti-NKG2D only (+) or isotype-matched control only (−) is shown (n =  3±SD). Right side shows the molecular density of anti-NKG2A on the slide (squares) and IFNγ secretion (open circles; n = 3±SD). (D) The proportion of NKL cells forming an actin ring (squares; n = 17–940) and the extent of spreading (circles; mean±SD; n = 36–175) on slides coated as in (C). (E) F-actin distribution (phalloidin-AlexaFluor633) in NKL cells spreading on slides coated as in (C) (concentration of NKG2A indicated). Scale bar  =  30 µm. (F) NKL on anti-NKG2D stripes interspersed with isotype-matched control mAb, showing bright field, anti-NKG2D stripes (red), and f-actin (phalloidin-AlexaFluor488; green). Scale bar  =  25 µm. (G) NKL YFP-actin (green) on anti-NKG2D (red) interspersed with mixed anti-NKG2D and anti-NKG2A. Scale bar  =  5 µm. (H) NKL YFP-actin (green) on anti-NKG2D (red) interspersed with mixed anti-NKG2D and anti-NKG2A. Scale bar  =  5 µm. (I) NKL on stripes of anti-NKG2A and anti-NKG2D (red) alternating with anti-NKG2D, showing f-actin (phalloidin-488; green). Scale bar  =  10 µm. (J) F-actin distribution in regions of cells in contact with anti-NKG2D stripes or with a mixture of anti-NKG2A and anti-NKG2D (***, p<0.001; n = 31 cells, paired t-test). (K) F-actin distribution following treatment with SHP inhibitor NSC87877 (n = 36). (L) The percent difference in f-actin accumulation between regions of cells in contact with anti-NKG2D or with anti-NKG2D and anti-NKG2A, in the presence or absence of NSC87877 (mean±SEM, n = 36).
Figure 4
Figure 4. NKG2D imposes symmetry and a stop signal; NKG2A breaks symmetry and delivers a reverse-stop signal.
(A) Area of contact between NKL and slides coated with combinations of LFA-1, NKG2D, and NKG2A mAb, fixed after 6 min (mean±SD, n  =  79–117, ***, p<0.0001, ANOVA). The percent of cells forming an actin ring determined by phalloidin staining is indicated above each bar. (B) Symmetry of NKL on slides coated with combinations of LFA-1, NKG2D, and NKG2A mAb. The distance from the centroid to the cell perimeter was measured at 360 equally spaced radii. Symmetry is quantified as the ratio of the longest to shortest radii and as the SD of all 360 radii (n = 20, ***, p<0.001, **, p<0.01 ANOVA). (C) Migration of a representative NKL cell on ICAM-1, measured by rate of radial movement of the cell circumference relative to the original cell centroid. Extension away from the original centre is coloured red and contraction blue, for each of 360 radii (y-axis) against time (x-axis). (D) NKL displacement (μm) from position at t  =  0, on slides coated with 2.5 µg/ml ICAM-1 in combination with MICA at concentrations indicated, with 2.5 µg/ml HLA-E or acid-denatured HLA-E (n = 8). (E) Frequency histograms for cell speeds measured at 10-s intervals, total number of time points analysed for each condition is indicted. (F) Average speed of cells on combinations of ICAM-1, MICA, HLA-E, or acid-denatured HLA-E (mean±SD, ***, p<0.001 versus ICAM-1 only, by ANOVA). Numbers indicate concentration of protein in μg/ml. (G) Duration of conjugation of YTS/KIR2DL1 with 221 (open squares) or 221/Cw6 (open circles). Cells were co-incubated in a small volume to allow conjugate formation and an excess of media added to prevent further conjugation. The proportion of NK cells remaining in conjugates was determined by flow cytometry. YTS and 221 (closed squares) and YTS-KIR2DL1 and 221-Cw6 (closed circles), which had not been premixed to form conjugates, are shown to control for conjugate formation after dilution (mean of three experiments±SD).

References

    1. Caligiuri M. A. Human natural killer cells. Blood. 2008;112:461–469. - PMC - PubMed
    1. Orange J. S. Formation and function of the lytic NK-cell immunological synapse. Nat Rev Immunol. 2008;8:713–725. - PMC - PubMed
    1. Krzewski K, Strominger J. L. The killer's kiss: the many functions of NK cell immunological synapses. Curr Opin Cell Biol. 2008;20:597–605. - PMC - PubMed
    1. Roda-Navarro P. Assembly and function of the natural killer cell immune synapse. Front Biosci. 2009;14:621–633. - PubMed
    1. Biron C. A, Nguyen K. B, Pien G. C, Cousens L. P, Salazar-Mather T. P. Natural killer cells in antiviral defense: function and regulation by innate cytokines. Annu Rev Immunol. 1999;17:189–220. - PubMed

Publication types

MeSH terms