

Genome-wide analysis of gene expression in primate taste buds reveals links to diverse processes
- PMID: 19636377
- PMCID: PMC2712080
- DOI: 10.1371/journal.pone.0006395
Genome-wide analysis of gene expression in primate taste buds reveals links to diverse processes
Abstract
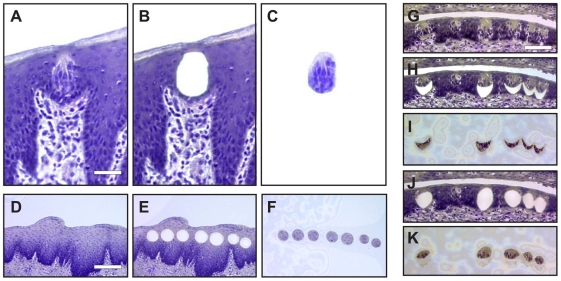
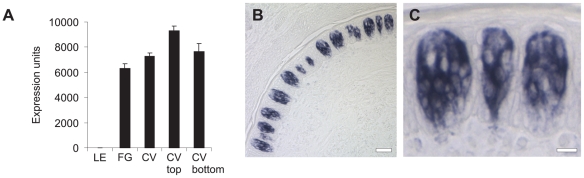
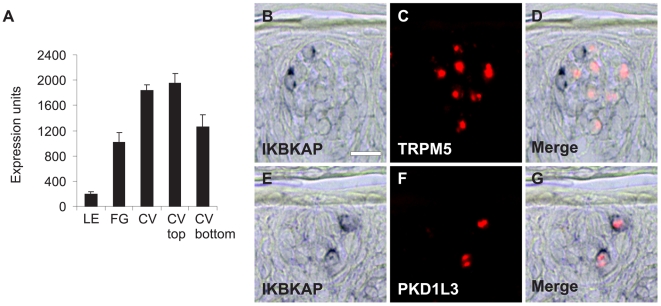
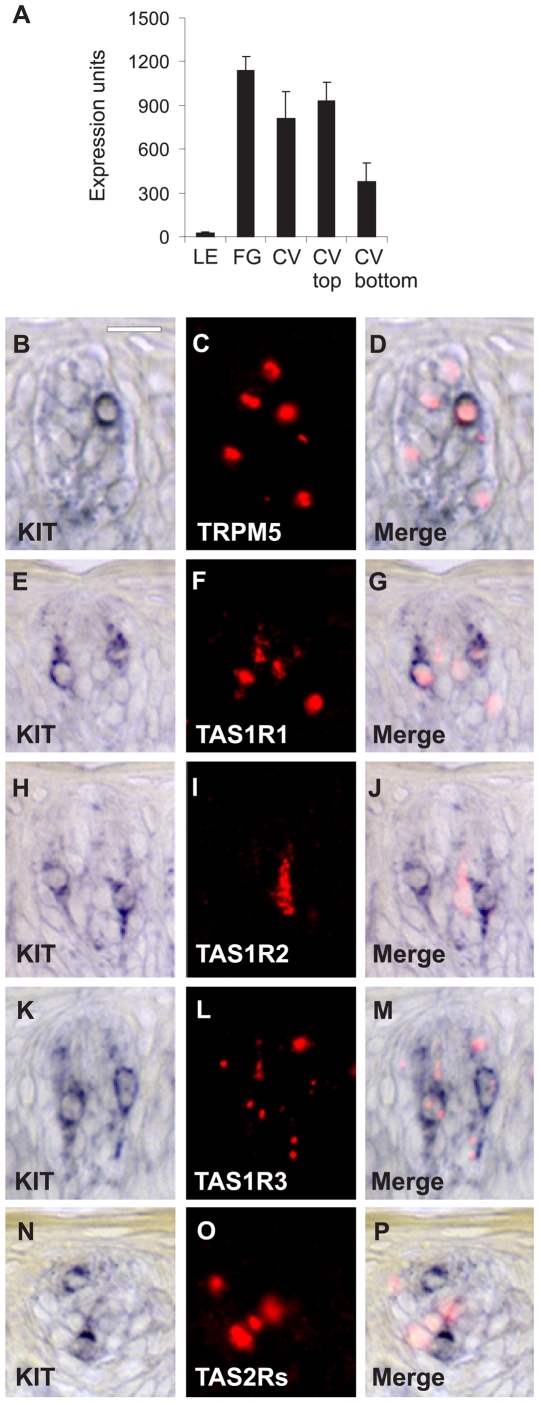
Efforts to unravel the mechanisms underlying taste sensation (gustation) have largely focused on rodents. Here we present the first comprehensive characterization of gene expression in primate taste buds. Our findings reveal unique new insights into the biology of taste buds. We generated a taste bud gene expression database using laser capture microdissection (LCM) procured fungiform (FG) and circumvallate (CV) taste buds from primates. We also used LCM to collect the top and bottom portions of CV taste buds. Affymetrix genome wide arrays were used to analyze gene expression in all samples. Known taste receptors are preferentially expressed in the top portion of taste buds. Genes associated with the cell cycle and stem cells are preferentially expressed in the bottom portion of taste buds, suggesting that precursor cells are located there. Several chemokines including CXCL14 and CXCL8 are among the highest expressed genes in taste buds, indicating that immune system related processes are active in taste buds. Several genes expressed specifically in endocrine glands including growth hormone releasing hormone and its receptor are also strongly expressed in taste buds, suggesting a link between metabolism and taste. Cell type-specific expression of transcription factors and signaling molecules involved in cell fate, including KIT, reveals the taste bud as an active site of cell regeneration, differentiation, and development. IKBKAP, a gene mutated in familial dysautonomia, a disease that results in loss of taste buds, is expressed in taste cells that communicate with afferent nerve fibers via synaptic transmission. This database highlights the power of LCM coupled with transcriptional profiling to dissect the molecular composition of normal tissues, represents the most comprehensive molecular analysis of primate taste buds to date, and provides a foundation for further studies in diverse aspects of taste biology.
Conflict of interest statement
Figures
Similar articles
-
Expression of genes encoding multi-transmembrane proteins in specific primate taste cell populations.PLoS One. 2009 Dec 4;4(12):e7682. doi: 10.1371/journal.pone.0007682. PLoS One. 2009. PMID: 19997627 Free PMC article.
-
Expression of BDNF and TrkB in mouse taste buds after denervation and in circumvallate papillae during development.Arch Histol Cytol. 2003 Mar;66(1):17-25. doi: 10.1679/aohc.66.17. Arch Histol Cytol. 2003. PMID: 12703550
-
A new gene (rmSTG) specific for taste buds is found by laser capture microdissection.Mamm Genome. 2001 Jan;12(1):60-6. doi: 10.1007/s003350010227. Mamm Genome. 2001. PMID: 11178745
-
Cellular mechanisms in taste buds.Bull Tokyo Dent Coll. 2007 Nov;48(4):151-61. doi: 10.2209/tdcpublication.48.151. Bull Tokyo Dent Coll. 2007. PMID: 18360101 Review.
-
Hedgehog Signaling Regulates Taste Organs and Oral Sensation: Distinctive Roles in the Epithelium, Stroma, and Innervation.Int J Mol Sci. 2019 Mar 16;20(6):1341. doi: 10.3390/ijms20061341. Int J Mol Sci. 2019. PMID: 30884865 Free PMC article. Review.
Cited by
-
A Transcription Factor Etv1/Er81 Is Involved in the Differentiation of Sweet, Umami, and Sodium Taste Cells.eNeuro. 2023 Apr 24;10(4):ENEURO.0236-22.2023. doi: 10.1523/ENEURO.0236-22.2023. Print 2023 Apr. eNeuro. 2023. PMID: 37045597 Free PMC article.
-
Sweet Taste Is Complex: Signaling Cascades and Circuits Involved in Sweet Sensation.Front Hum Neurosci. 2021 Jun 22;15:667709. doi: 10.3389/fnhum.2021.667709. eCollection 2021. Front Hum Neurosci. 2021. PMID: 34239428 Free PMC article. Review.
-
Chemokine-Derived Peptides: Novel Antimicrobial and Antineoplasic Agents.Int J Mol Sci. 2015 Jun 8;16(6):12958-85. doi: 10.3390/ijms160612958. Int J Mol Sci. 2015. PMID: 26062132 Free PMC article. Review.
-
Taste bud homeostasis in health, disease, and aging.Chem Senses. 2014 Jan;39(1):3-16. doi: 10.1093/chemse/bjt059. Epub 2013 Nov 28. Chem Senses. 2014. PMID: 24287552 Free PMC article. Review.
-
METEORIN-LIKE is a cytokine associated with barrier tissues and alternatively activated macrophages.Clin Immunol. 2015 Feb;156(2):119-27. doi: 10.1016/j.clim.2014.11.006. Epub 2014 Dec 5. Clin Immunol. 2015. PMID: 25486603 Free PMC article.
References
-
- Kimura S. Taste and nutrition. Nutr Rev. 1992;50:427–433. - PubMed
-
- Ravasco P. Aspects of taste and compliance in patients with cancer. Eur J Oncol Nurs. 2005;9(Suppl 2):S84–91. - PubMed
-
- Miura H, Kusakabe Y, Harada S. Cell lineage and differentiation in taste buds. Arch Histol Cytol. 2006;69:209–225. - PubMed
-
- Chandrashekar J, Hoon MA, Ryba NJ, Zuker CS. The receptors and cells for mammalian taste. Nature. 2006;444:288–294. - PubMed
Publication types
MeSH terms
LinkOut - more resources
Full Text Sources
Other Literature Sources
Molecular Biology Databases
