

Modeling multisensory enhancement with self-organizing maps
- PMID: 19636382
- PMCID: PMC2713735
- DOI: 10.3389/neuro.10.008.2009
Modeling multisensory enhancement with self-organizing maps
Abstract
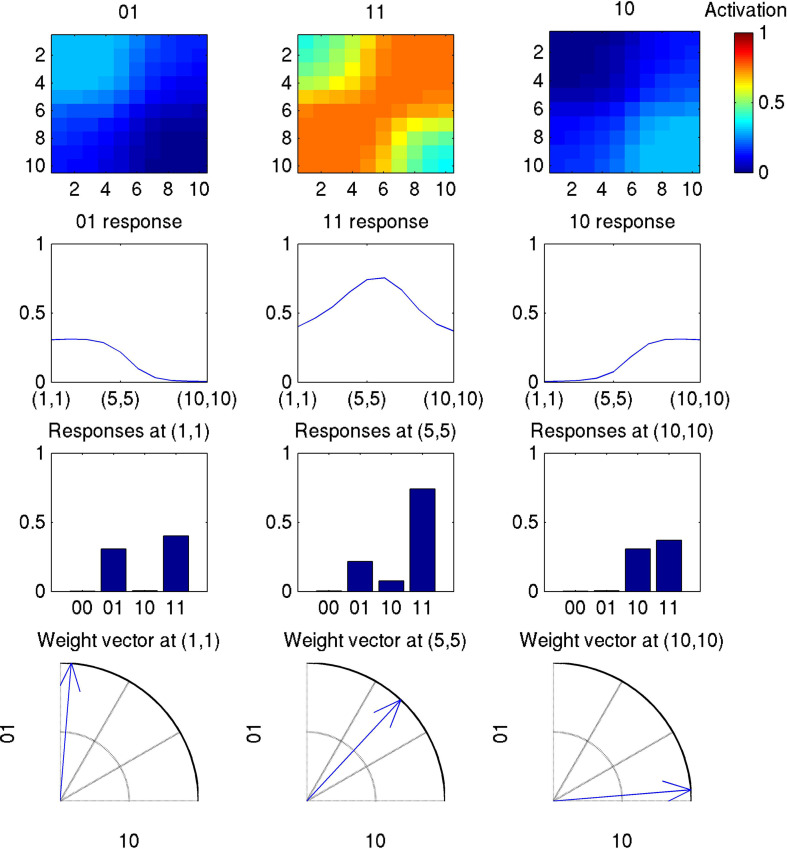
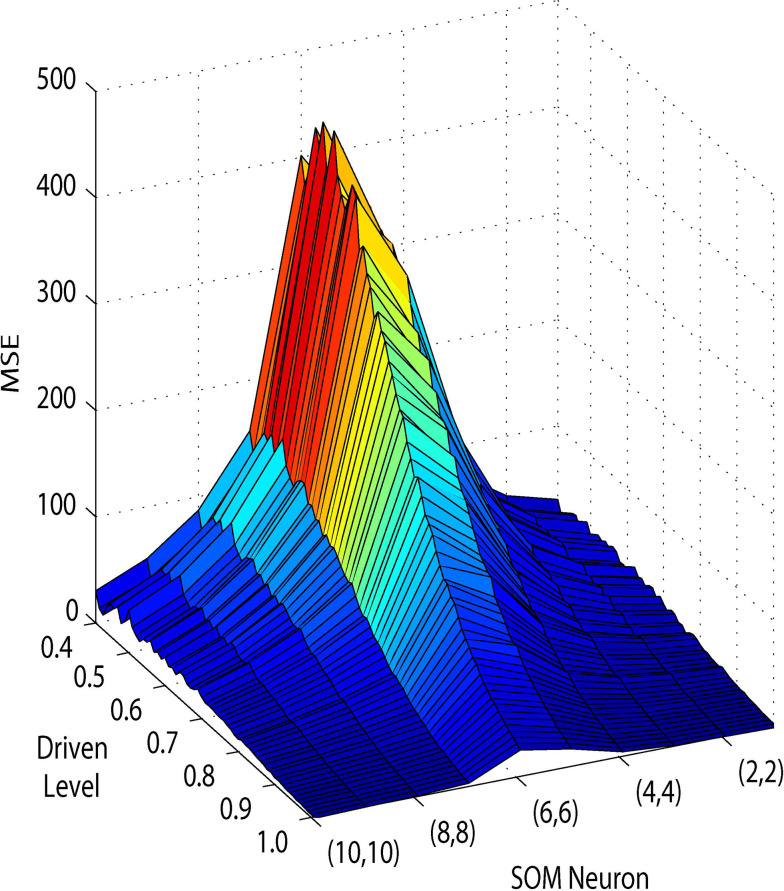
Self-organization, a process by which the internal organization of a system changes without supervision, has been proposed as a possible basis for multisensory enhancement (MSE) in the superior colliculus (Anastasio and Patton, 2003). We simplify and extend these results by presenting a simulation using traditional self-organizing maps, intended to understand and simulate MSE as it may generally occur throughout the central nervous system. This simulation of MSE: (1) uses a standard unsupervised competitive learning algorithm, (2) learns from artificially generated activation levels corresponding to driven and spontaneous stimuli from separate and combined input channels, (3) uses a sigmoidal transfer function to generate quantifiable responses to separate inputs, (4) enhances the responses when those same inputs are combined, (5) obeys the inverse effectiveness principle of multisensory integration, and (6) can topographically congregate MSE in a manner similar to that seen in cortex. Thus, the model provides a useful method for evaluating and simulating the development of enhanced interactions between responses to different sensory modalities.
Keywords: artificial neural networks; competitive learning; computational modeling; multisensory integration; self-organization; superior colliculus.
Figures


Similar articles
-
A two-stage unsupervised learning algorithm reproduces multisensory enhancement in a neural network model of the corticotectal system.J Neurosci. 2003 Jul 30;23(17):6713-27. doi: 10.1523/JNEUROSCI.23-17-06713.2003. J Neurosci. 2003. PMID: 12890764 Free PMC article.
-
Representation and integration of multiple sensory inputs in primate superior colliculus.J Neurophysiol. 1996 Aug;76(2):1246-66. doi: 10.1152/jn.1996.76.2.1246. J Neurophysiol. 1996. PMID: 8871234
-
Attention modeled as information in learning multisensory integration.Neural Netw. 2015 May;65:44-52. doi: 10.1016/j.neunet.2015.01.004. Epub 2015 Feb 2. Neural Netw. 2015. PMID: 25688997
-
Neural mechanisms for synthesizing sensory information and producing adaptive behaviors.Exp Brain Res. 1998 Nov;123(1-2):124-35. doi: 10.1007/s002210050553. Exp Brain Res. 1998. PMID: 9835401 Review.
-
Neurocomputational approaches to modelling multisensory integration in the brain: a review.Neural Netw. 2014 Dec;60:141-65. doi: 10.1016/j.neunet.2014.08.003. Epub 2014 Aug 23. Neural Netw. 2014. PMID: 25218929 Review.
Cited by
-
Connectional parameters determine multisensory processing in a spiking network model of multisensory convergence.Exp Brain Res. 2011 Sep;213(2-3):329-39. doi: 10.1007/s00221-011-2671-6. Epub 2011 Apr 12. Exp Brain Res. 2011. PMID: 21484394
-
Over my fake body: body ownership illusions for studying the multisensory basis of own-body perception.Front Hum Neurosci. 2015 Mar 24;9:141. doi: 10.3389/fnhum.2015.00141. eCollection 2015. Front Hum Neurosci. 2015. PMID: 25852524 Free PMC article. Review.
-
Organization, maturation, and plasticity of multisensory integration: insights from computational modeling studies.Front Psychol. 2011 May 2;2:77. doi: 10.3389/fpsyg.2011.00077. eCollection 2011. Front Psychol. 2011. PMID: 21687448 Free PMC article.
-
An emergent model of multisensory integration in superior colliculus neurons.Front Integr Neurosci. 2010 Mar 22;4:6. doi: 10.3389/fnint.2010.00006. eCollection 2010. Front Integr Neurosci. 2010. PMID: 20431725 Free PMC article.
References
-
- Ahmad K., Bale T., Casey M. (2002). Connectionist simulation of quantification skills. Connect. Sci. 14, 165–201.10.1080/09540090208559326 - DOI
Grants and funding
LinkOut - more resources
Full Text Sources