. 2009 Jul 28;4(7):e6315.
doi: 10.1371/journal.pone.0006315.

Structural models of human eEF1A1 and eEF1A2 reveal two distinct surface clusters of sequence variation and potential differences in phosphorylation

Affiliations

Structural models of human eEF1A1 and eEF1A2 reveal two distinct surface clusters of sequence variation and potential differences in phosphorylation

Dinesh C Soares et al. PLoS One. .

Abstract

Background: Despite sharing 92% sequence identity, paralogous human translation elongation factor 1 alpha-1 (eEF1A1) and elongation factor 1 alpha-2 (eEF1A2) have different but overlapping functional profiles. This may reflect the differential requirements of the cell-types in which they are expressed and is consistent with complex roles for these proteins that extend beyond delivery of tRNA to the ribosome.

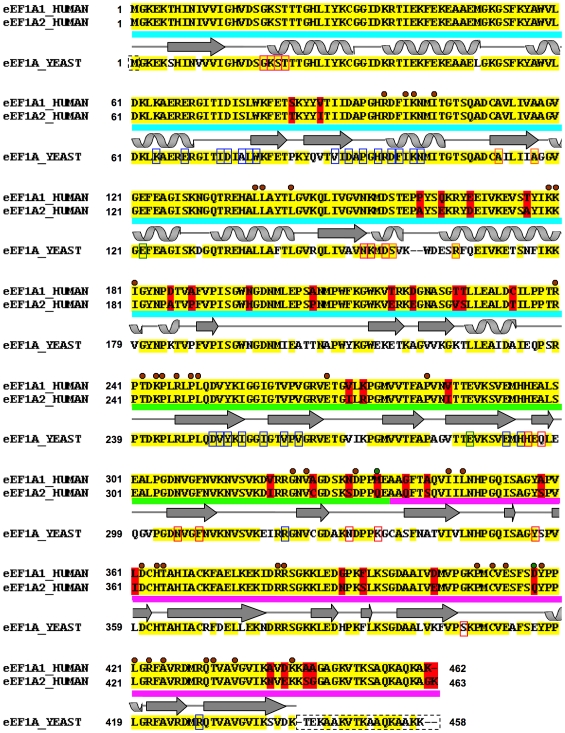
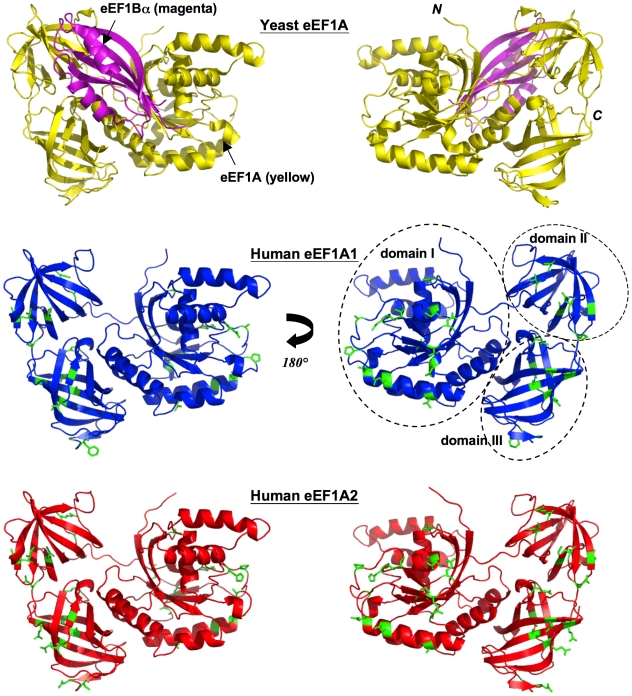
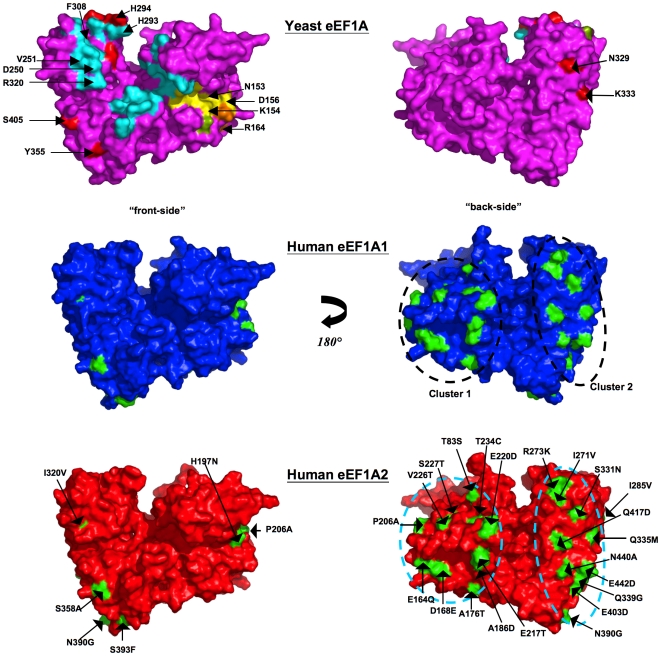
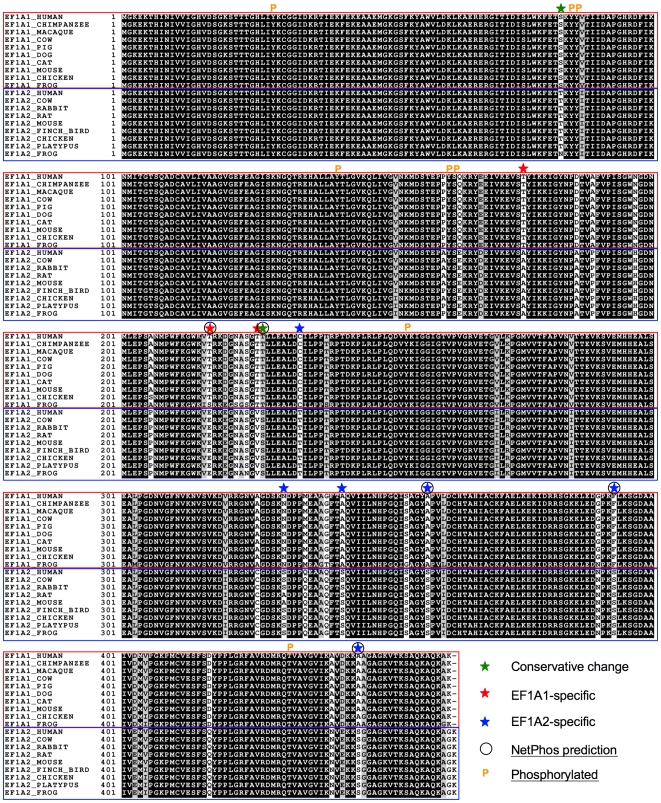
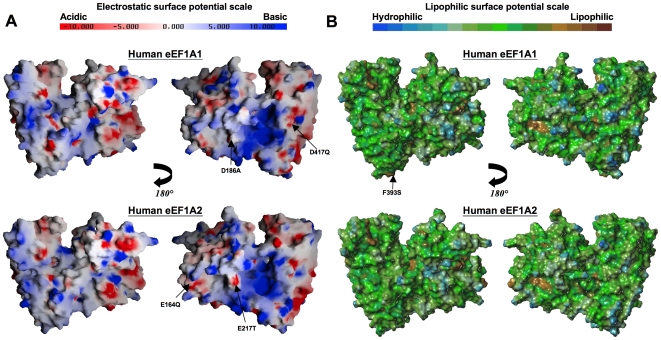
Methodology/principal findings: To investigate the structural basis of these functional differences, we created and validated comparative three-dimensional (3-D) models of eEF1A1 and eEF1A2 on the basis of the crystal structure of homologous eEF1A from yeast. The spatial location of amino acid residues that vary between the two proteins was thereby pinpointed, and their surface electrostatic and lipophilic properties were compared. None of the variations amongst buried amino acid residues are judged likely to have a major structural effect on the protein fold, or to affect domain-domain interactions. Nearly all the variant surface-exposed amino acid residues lie on one face of the protein, in two proximal but distinct sub-clusters. The result of previously performed mutagenesis in yeast may be interpreted as confirming the importance of one of these clusters in actin-bundling and filament disorganization. Interestingly, some variant residues lie in close proximity to, and in a few cases show differences in interactions with, residues previously inferred to be directly involved in binding GTP/GDP, eEF1Balpha and aminoacyl-tRNA. Additional sequence-based predictions, in conjunction with the 3-D models, reveal likely differences in phosphorylation sites that could reconcile some of the functional differences between the two proteins.

Conclusions: The revelation and putative functional assignment of two distinct sub-clusters on the surface of the protein models should enable rational site-directed mutagenesis, including homologous reverse-substitution experiments, to map surface binding patches onto these proteins. The predicted variant-specific phosphorylation sites also provide a basis for experimental verification by mutagenesis. The models provide a structural framework for interpretation of the resulting functional analysis.


Conflict of interest statement

Competing Interests: The authors have declared that no competing interests exist.

Figures

Figure 1
Figure 1. Sequence alignment between human eEF1A1 and eEF1A2 and yeast template.
The pair-wise sequence alignment between human eEF1A1 and eEF1A2 is shown: identical residues (yellow background), variant residues (red background). The aligned yeast eEF1A template is shown below with identical residues to the human sequences highlighted (yellow background) and any variant position between yeast and either human sequence shown with a white background. The two human sequences share 92% sequence identity with each other and each show ∼81% sequence identity with the yeast protein. The domain boundaries (domain I: cyan; domain II: green; domain III: pink), and STRIDE secondary structure assignment is traced above the yeast template sequence (arrows = beta-strands; coils = alpha-helices). The amino acid residues involved in domain-domain contacts are indicated with a brown circle (green circle for non-identical equivalent residues between two human variants); those involved in the binding of C-terminal fragment eEF1Bα are indicated on the yeast sequence with blue rectangles; residues involved in GDP-binding indicated in pink rectangles; and those disordered in the yeast crystal structure are indicated with a dashed rectangle. Yeast mutagenesis data and motifs are highlighted on its sequence: mutations involved in actin bundling/disorganization (red rectangles) , ; mutations that affect translational fidelity (green rectangles) ; mutations that reduce dependence on eEF1B (orange rectangles) , .
Figure 2
Figure 2. Yeast template, human eEF1A1 and eEF1A2 models.
Two views rotated by 180° about the y-axis depicting cartoon schematic representations of: the yeast eEF1A (yellow)-eEF1Bα C-terminal fragment (magenta) crystal structure (top panel). The 3-D models of eEF1A1 (blue, middle panel), and eEF1A2 (red, lower panel) show the location of variant side-chains (in stick representation) between the two proteins, colored green. Secondary structure elements have been assigned by default settings in PyMol (http://www.pymol.org) and position of domains labeled.
Figure 3
Figure 3. Location of variations in amino acids mapped onto surface.
Two equivalent views rotated by 180° about the y-axis depicting a surface rendition of the yeast eEF1A crystal structure colored magenta (top panel), and the 3-D models of eEF1A1 colored blue (middle panel) and eEF1A2 colored red (bottom panel). Locations of exposed variant side-chains are mapped onto the surface of the two model proteins (colored green) and labeled on the eEF1A2 model - the variant residue from eEF1A1 is shown on the right-hand side of the label. The two sub-clusters are apparent in this representation. The location of the C-terminal eEF1Bα-binding site (cyan) and GDP-binding site (yellow) is mapped on the crystal structure. Also highlighted (red) on its surface are: mutations that reduce actin disorganization induced by overexpression of eEF1A, inhibit actin-bundling without altering translation in vivo, and reduce actin-bundling , . There are no variants in proximity to those residues implicated on the basis of mutagenesis to be involved in translational fidelity (green) . However, two variant positions in humans - Gln164Glu and Glu168Asp are in close proximity to Arg166 – a conservative mutation for the equivalent residue in yeast (Arg164Lys) was shown to reduce dependence on eEF1B (orange) , . Gln164Glu and Glu168Asp, however, both retain their main-chain to main-chain H-bonds with Arg166. Note: for clarity the three proposed aminoacyl-tRNA-binding residues are not shown, since they overlap with already highlighted positions implicated in binding eEF1Bα (His293 and Arg320) and actin (His294).
Figure 4
Figure 4. Multiple sequence alignment of eEF1A1 and eEF1A2 orthologues.
ClustalX alignment of eEF1A1 and eEF1A2 sequences from a range of higher order eukaryotes. The results are shaded using BOXSHADE v3.21 (black background = strictly conserved; grey or white background = conservatively substituted or non-conserved). A star-symbol denotes the position of variant Ser and Thr amino acid residues for the two proteins and color-coded according to variant (red = eEF1A1-specific; blue = eEF1A2-specific). NetPhos-predicted phosphorylation sites are indicated by a circle, and experimentally determined phosphorylation sites shown with a ‘P’ symbol (these are mapped on the models in Supplementary file S6).
Figure 5
Figure 5. Surface properties of the models eEF1A1 and eEF1A2.
(A) Two equivalent views, rotated by 180° about the y-axis, of a GRASP-generated surface electrostatic representation of eEF1A1 (upper panel) and eEF1A2 (lower panel). Negative charge is colored red and positive charge colored blue, ranging from -10 kT to +10 kT (k = Boltzmann's constant; T = temperature in Kelvin). Charged residues not present in either protein (non-conservative charged substitutions only) are labeled – the variant equivalent residue is shown on the right-hand side of the label. (B) Two equivalent views, rotated by 180° about the y-axis, of a MOLCAD-generated lipophilic surface rendition of the models. Regions of high lipophilicity or hydrophobicity are colored brown and regions of high hydrophilicity are colored blue.

Similar articles

Cited by

References

    1. Lund A, Knudsen SM, Vissing H, Clark B, Tommerup N. Assignment of human elongation factor 1alpha genes: EEF1A maps to chromosome 6q14 and EEF1A2 to 20q13.3. Genomics. 1996;36:359–361. - PubMed
    1. Lee S, Francoeur AM, Liu S, Wang E. Tissue-specific expression in mammalian brain, heart, and muscle of S1, a member of the elongation factor-1 alpha gene family. J Biol Chem. 1992;267:24064–24068. - PubMed
    1. Chambers DM, Peters J, Abbott CM. The lethal mutation of the mouse wasted (wst) is a deletion that abolishes expression of a tissue-specific isoform of translation elongation factor 1alpha, encoded by the Eef1a2 gene. Proc Natl Acad Sci U S A. 1998;95:4463–4468. - PMC - PubMed
    1. Newbery HJ, Loh DH, O'Donoghue JE, Tomlinson VA, Chau YY, et al. Translation elongation factor eEF1A2 is essential for post-weaning survival in mice. J Biol Chem. 2007;282:28951–28959. - PubMed
    1. Kahns S, Lund A, Kristensen P, Knudsen CR, Clark BF, et al. The elongation factor 1 A-2 isoform from rabbit: cloning of the cDNA and characterization of the protein. Nucleic Acids Res. 1998;26:1884–1890. - PMC - PubMed

Publication types

Substances