. 2009:2009:627840.
doi: 10.1155/2009/627840. Epub 2009 Jul 19.

Studies on Multifunctional Effect of All-Trans Retinoic Acid (ATRA) on Matrix Metalloproteinase-2 (MMP-2) and Its Regulatory Molecules in Human Breast Cancer Cells (MCF-7)

Affiliations

Studies on Multifunctional Effect of All-Trans Retinoic Acid (ATRA) on Matrix Metalloproteinase-2 (MMP-2) and Its Regulatory Molecules in Human Breast Cancer Cells (MCF-7)

Anindita Dutta et al. J Oncol. 2009.

Abstract

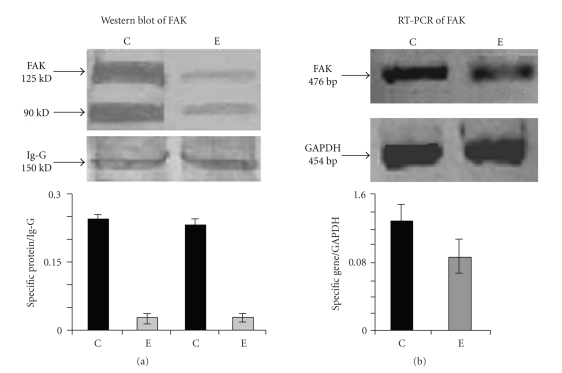
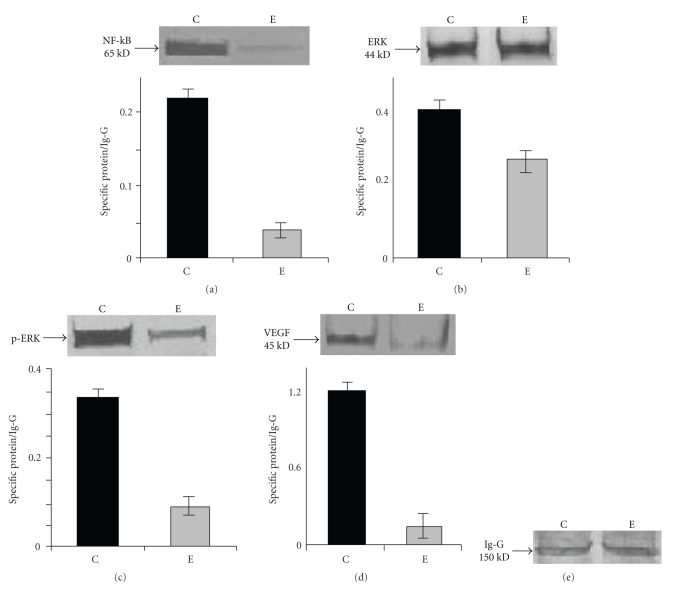
Background. Vitamin A derivative all-trans retinoic acid (ATRA) is considered as a potent chemotherapeutic drug for its capability of regulating cell growth and differentiation. We studied the effect of ATRA on MMP-2 in MCF-7, human breast cancer cells, and the probable signaling pathways which are affected by ATRA on regulating pro-MMP-2 activity and expression. Methods. Gelatin zymography, RT-PCR, ELISA, Western blot, Immunoprecipitation, and Cell adhesion assay are used. Results. Gelatin zymography showed that ATRA caused a dose-dependent inhibition of pro-MMP-2 activity. ATRA treatment downregulates the expression of MT1-MMP, EMMPRIN, FAK, NF-kB, and p-ERK. However, expression of E-cadherin, RAR, and CRABP increased upon ATRA treatment. Binding of cells to extra cellular matrix (ECM) protein fibronectin reduced significantly after ATRA treatment. Conclusions. The experimental findings clearly showed the inhibition of MMP-2 activity upon ATRA treatment. This inhibitory effect of ATRA on MMP-2 activity in human breast cancer cells (MCF-7) may result due to its inhibitory effect on MT1-MMP, EMMPRIN, and upregulation of TIMP-2. This study is focused on the effect of ATRA on MMP, MMP-integrin-E-cadherin interrelationship, and also the effect of the drug on different signaling molecules which may involve in the progression of malignant tumor development.


Figures

Figure 1
Figure 1
Cell viability assay: MCF-7 (300,000 cells/1.5 mL) (Figure 1(a)) and A375 (300,000/mL) (Figure 1(b)) cells were grown in serum-free culture medium (SFCM) in absence (Control) and in presence of 30 μM ATRA (Treated) for 24 hours (Figure 1(a)) and 48 hours (Figure 1(b)). Cells were collected and 0.4% trypan blue solution was added in both control and ATRA-treated cell suspension. Number of blue cells and nonblue cells were counted and t-test was done to obtain the P-values. Zymographic analysis of pro-MMP-2 activity: MCF-7 (300,000 cells/1.5 mL) cells were grown in serum-free culture medium (SFCM) in absence (control) (lane C) and in presence of 10 (lane 1), 20 (lane 2), 30 (lane 3) μM ATRA for 24 hours (Figure 1(c)). The culture supernatants were collected and MMPs were concentrated using Gelatin-sepharose 4B beads. Gelatinases were eluted from bead with sample buffer and subjected to zymography on 7.5% SDS-PAGE copolymerised with 0.1% gelatin. The zymogram was treated with 2.5% triton X-100 for 30 minutes followed by incubation in reaction buffer for 20 hours and stained with coomassie blue. The quantitative measurement of the zymogram (Figure 1(c)) was performed by using Image J Launcher (version 1.4.3.67). (C) shows the pro-MMP-2 activity in the SFCM of control cells. (1) is the representative of pro-MMP-2 activity in the SFCM of 10 μM ATRA-treated cells. (2) and (3) represents the pro-MMP-2 activity in the SFCM of 20 and 30 μM ATRA-treated cells (for 24 hours), respectively.
Figure 2
Figure 2
ELISA of TIMP-2, E-cadherin, RAR and CRABP: MCF-7 (300,000 cells/1.5 mL) cells were grown in serum free culture medium (SFCM) in absence (C) and in presence of 30 μM ATRA (E) for 24 hours. The culture supernatants were collected and the wells of an ELISA plate was coated with 50 μL SFCM (for TIMP-2) and 50 μg of protein (for E-cadherin, RAR & CRABP) from both control and ATRA-treated cells and kept at 4°C for overnight. The next day contents of the wells were discarded and the wells were washed with blocking buffer. Then 50 μL of blocking buffer was added to each well and kept at 37°C for 1 hour. The blocking buffer was discarded and the wells were washed with washing buffer. The wells were then reacted with anti-TIMP-2 (Figure 2), anti-Ecadherin (Figure 5(c)), anti-RAR (Figure 8(a)), anti CRABP (Figure 8(b)) antibody, respectively, and kept in 37°C for 1 hour. The wells were washed with washing buffer and reacted with respective HRP-coupled secondary antibody and kept in 37°C for 1 hour. The wells were washed with washing buffer and then TMB substrate was added to each well for color development. The color reaction was stopped with 1 M H2SO4 solution and OD of each well was measured at 450 nm. The OD indicated the expression level of TIMP-2 (P = .000144 (P < .05)) in control and treated MCF-7 cells.
Figure 3
Figure 3
Western blot of MT1-MMP and EMMPRIN: MCF-7 (300,000 cells/1.5 mL) cells were grown in absence (lane C) and presence of 30 μM ATRA (lane E) for 24 hours in SFCM. The cells were collected and were extracted in cell extraction buffer. 50 μg of protein from both control and ATRA-treated cell extracts were run on 7.5% SDS-PAGE and the proteins were transferred onto nitrocellulose membrane by western blot. The membrane was incubated with anti MT1-MMP (Figure 3(a)) and EMMPRIN (Figure 3(b)) antibody and then after washing membrane was incubated with respective alkaline phosphatase coupled secondary antibody. Bands were visualized using NBT-BCIP as substrate. Ig-G was used as internal control. The quantitative measurement of the western blot (Figures 3(a) and 3(b)) was performed by Image J Launcher (version 1.4.3.67). (C) is the amount of MT1-MMP and EMMPRIN expression in the control cells, respectively, and (E) is the amount of MT1-MMP and EMMPRIN expression of 30 μM ATRA-treated (for 24 hours) MCF-7 cells, respectively.
Figure 4
Figure 4
RT-PCR of MMP-2: MCF-7 (300,000 cells/1.5 mL) cells were grown in absence (lane C) and in presence of 30 μM ATRA (lane E) for 24 hours in SFCM. Cells were washed in PBS and total RNA were extracted (RNAqueous for PCR, Ambion). Two-step RT-PCR (Retroscript, Ambion) was done with equal amounts of total RNA using specific primers for MMP-2 PCR. 20 μL of each PCR products were run on a 2.5% agarose gel and bands visualised under UV. GAPDH primers were used to confirm equal loading. Documentation was done in Gel Doc (Image Master VDS, Pharmacia, Biotech).
Figure 5
Figure 5
(a) Cell Adhesion Assay: MCF-7 cells (300,000 cells/1.5 mL) were grown in absence (Control) and in presence of 30 μM ATRA for 24 hours in 10% MEM. Microtitre wells were coated with various concentrations of fibronectin and kept at 37°C for 1.5 hour. 1% BSA solution was used to block the nonspecific sites. Control and ATRA-treated cells were collected by trypsinization and 50,000 cells were added to each well. After 1 hour of incubation wells were washed thoroughly, number of bound cells was counted on a haemocytometer, and the % of cells adhered to the ligand was calculated. (b) RT-PCR of α5 & β1: MCF-7 (300,000 cells/5 mL) cells were grown in absence (lane C) and in presence of 30 μM ATRA (lane E) for 24 hours in SFCM. Two steps RT-PCR (Retroscript, Ambion) was done as before with equal amounts of total RNA using specific primers for α5 & β1. GAPDH was used as internal control. (c) ELISA of E-cadherin: ELISA of E-cadherin was performed with anti-E-cadherin antibody in control (C) and ATRA treated (E) MCF-7 cells. P = .01613 (P < .05) indicates that the difference in E-cadherin expression between control and ATRA treated MCF-7 cell is statistically significant.
Figure 6
Figure 6
(a) Western blot analysis of FAK: MCF-7 (300,000 cells/1.5 mL) cells were grown in absence (lane C) and presence of 30 μM ATRA (lane E) for 24 hours in SFCM. The cells were collected and were extracted in cell extraction buffer. 50 μg of protein from both control and ATRA-treated cell extracts were run on 7.5% SDS-PAGE and the proteins were transferred onto nitrocellulose membrane by western blot. The membrane was incubated with anti-FAK antibody followed by incubation with alkaline phosphatase coupled secondary antibody. Bands were visualized using NBT-BCIP as substrate. Quantitative measurements of immunoblot was done by using Image J Launcher (version 1.4.3.67). (C) represents the expression of respective proteins in control cells whereas (E) represents expression in 30 μM ATRA treated cells. (b) RT-PCR of FAK: Figure 6(b) showed the status of FAK mRNA expression in control (lane C) and ATRA treated (lane E) MCF-7 cells. A quantitative measurement of RT-PCR (Figure 6(b)) was done by using Image J Launcher (version 1.4.3.67). (C) represents the expression of FAK in control cells whereas (E) represents FAK expression 30 μM ATRA treated cells in respective figures.
Figure 7
Figure 7
(a) Western blot of NF-kB: NF-kB expression in control (lane C) and ATRA treated (lane E) MCF-7 cells was observed by western blot analysis as before using anti-NF-κB primary antibody. Quantitative measurements of immunoblots were done by using Image J Launcher (version 1.4.3.67). (C) represents the expression of respective proteins in control cells whereas (E) represents expression in 30 μM ATRA treated cells. (b), (c), and (d) Immunoblot assay of ERK, p-ERK, and VEGF: MCF-7 cells (300,000 cells/1.5 mL) were grown in absence (lane C) and presence of 30 μM ATRA (lane E) for 24 hours in SFCM. Cells were collected and extracted in cell extraction buffer. ERK and PI-3K were immunoprecipitated from 150 μg of protein from both control and ATRA-treated cell extract with anti-ERK & protein G Agarose bead (Figures 7(b) and 7(c)) and with anti-VEGF & protein G Agarose bead (Figure 7(d)), keeping the samples for overnight at 4°C with shaking. In each case the resultant immune complex was washed thrice with PBS and the respective protein bound with antibody were eluted from the agarose bead using 1X sample buffer. Samples were then incubated in β-mercaptoethanol for 10 minutes at 90°C. Samples were subjected to electrophoresis on 7.5% SDS-PAGE. The proteins were transferred to nitrocellulose membrane by Western Blot. The membranes were incubated with anti-ERK (Figure 7(b)), anti-phospho ERK (Figure 7(c)), and anti-VEGF antibody (Figure 7(d)), respectively. The immunoblots were then incubated with alkaline phosphatase-coupled secondary antibodies and bands were visualized by NBT/BCIP substrate. Ig-G (Figure 7(e)) was used to confirm equal loading. Quantitative measurements of immunoblots were done by using Image J Launcher (version 1.4.3.67). (C) represents the expression of respective proteins in control cells whereas (E) represents expression in 30 μM ATRA treated cells.
Figure 8
Figure 8
ELISA of RAR & CRABP: The status of RAR (Figure 8(a)) and CRABP (Figure 8(b)) in control (C) and ATRA treated (E) MCF-7 cells were analysed by ELISA as before using anti-RAR and anti-CRABP primary antibody and respective secondary antibodies. The OD indicates the expression level of RAR (Figure 8(a); P = .028334 (P < .05)) and CRABP (Figure 8(b); P = .028 (P < .05)) in whole cell extract.

Similar articles

Cited by

References

    1. Axel DI, Frigge A, Dittmann J, et al. All-trans retinoic acid regulates proliferation, migration, differentiation, and extracellular matrix turnover of human arterial smooth muscle cells. Cardiovascular Research. 2001;49(4):851–862. - PubMed
    1. de Thé H, Chelbi-Alix MK. APL, a model disease for cancer therapies? Oncogene. 2001;20(49):7136–7139. - PubMed
    1. Taraboletti G, Borsotti P, Chirivi RGS, et al. Effect of all trans-retinoic acid (ATRA) on the adhesive and motility properties of acute promyelocytic leukemia cells. International Journal of Cancer. 1997;70(1):72–77. - PubMed
    1. Chen Y, Dokmanovic M, Stein WD, Ardecky RJ, Roninson IB. Agonist and antagonist of retinoic acid receptors cause similar changes in gene expression and induce senescence-like growth arrest in MCF-7 breast carcinoma cells. Cancer Research. 2006;66(17):8749–8761. - PubMed
    1. Abu J, Batuwangala M, Herbert K, Symonds P. Retinoic acid and retinoid receptors: potential chemopreventive and therapeutic role in cervical cancer. Lancet Oncology. 2005;6(9):712–720. - PubMed