. 2009 Jul 28;4(7):e6386.
doi: 10.1371/journal.pone.0006386.

Metabolomics reveals metabolic biomarkers of Crohn's disease

Affiliations

Metabolomics reveals metabolic biomarkers of Crohn's disease

Janet Jansson et al. PLoS One. .

Abstract

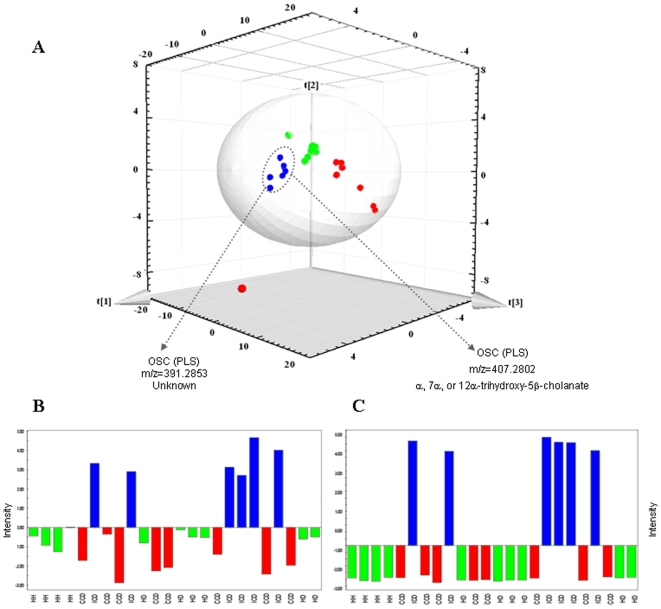
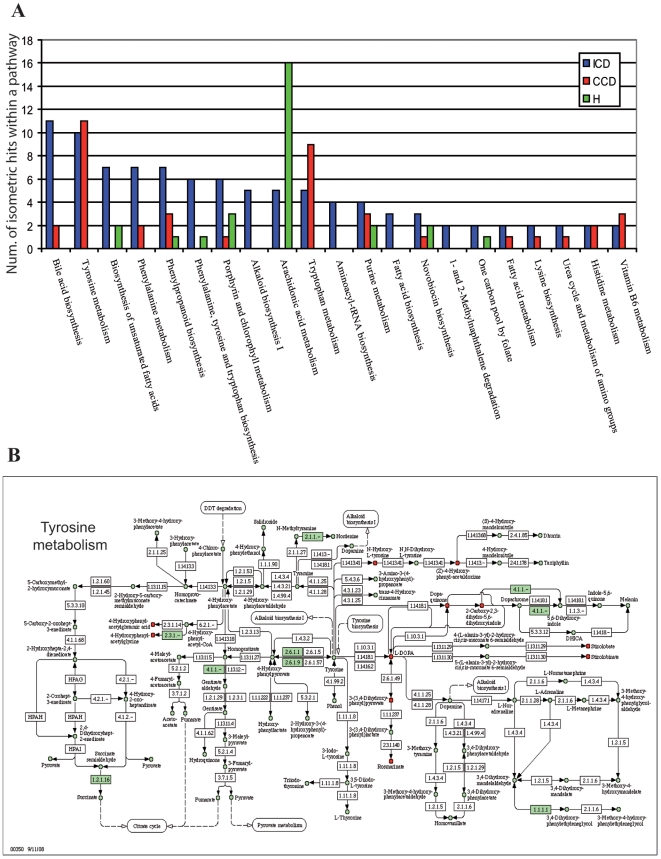
The causes and etiology of Crohn's disease (CD) are currently unknown although both host genetics and environmental factors play a role. Here we used non-targeted metabolic profiling to determine the contribution of metabolites produced by the gut microbiota towards disease status of the host. Ion Cyclotron Resonance Fourier Transform Mass Spectrometry (ICR-FT/MS) was used to discern the masses of thousands of metabolites in fecal samples collected from 17 identical twin pairs, including healthy individuals and those with CD. Pathways with differentiating metabolites included those involved in the metabolism and or synthesis of amino acids, fatty acids, bile acids and arachidonic acid. Several metabolites were positively or negatively correlated to the disease phenotype and to specific microbes previously characterized in the same samples. Our data reveal novel differentiating metabolites for CD that may provide diagnostic biomarkers and/or monitoring tools as well as insight into potential targets for disease therapy and prevention.


Conflict of interest statement

Competing Interests: The authors have declared that no competing interests exist.

Figures

Figure 1
Figure 1. (A) Score and loading scatter plot of PLS analysis (Q2(cum) = 0.96, R2(Y) = 0.95).
(blue • = ICD, red • = CCD and green • = Healthy). The masses with the highest regression coefficients were considered as discriminant. Coordinates on the figure axes are ×108. (B) Example of a differentiating metabolite for ICD (assigned at m/z of 391.2853) that is up regulated in the ICD group but the structure is unknown. (C) Mass at m/z of 407.2802 corresponding to 3α, 7α, or 12α-trihydroxy-5β-cholanate within the bile acid biosynthesis pathway. The intensities in B and C were normalized.
Figure 2
Figure 2. (A) KEGG pathways that discriminated the three groups: ICD CCD and healthy.
The m/z were selected after the validation of PLS model; (B) Tyrosine metabolism pathway, the red metabolites were identified and present in the ICD group. Green shading refers to enzymes that were annotated in Bacteroides vulgatus.
Figure 3
Figure 3. Similarity plot (using Jaccard's index) of (A) microbial composition based on binary T-RFLP data and (B) ICR-FT/MS data, respectively, from fecal samples of individuals with ICD (blue), CCD (red) and healthy individuals (green).
Individuals were numbered according to Table S1, and as previously defined (11). Boxes indicate twin pairs that share the most similar metabolic and microbial profiles. Note: metaproteome data from the same fecal samples for individuals 6a and 6b have recently been published .
Figure 4
Figure 4. PLS loading plot (A) where bacterial abundance defined the Y matrix and ICR-FT/MS data were plotted as predictors of differentiating bacteria based on their regression coefficients.
Masses with the greatest regression coefficients for specific bacterial populations that were more abundant [B. ovatus (BO), B. vulgatus (BV), and Escherichia coli (EC)] and less abundant [Faecalibacterium prausnitzii (FP) and Bacteroides uniformis (BU)] in the feces of individuals with ileal Crohn's disease (ICD) compared to individuals with colonic Crohn's disease (CCD) and healthy (H) individuals are identified in the heat plot (B). The heat plot indicates the abundance of masses, the predicted metabolite, the bacteria that were positively correlated to that metabolite and whether the metabolite was positively (+) or negatively (−) associated with ICD. The clustering on the x-axis is according to disease and that on the y-axis is according to the relative abundances of the same bacterial populations selected in (A) and corresponding abbreviations are given on the first column to the right of the heat plot. Individuals on the x-axis are coded according to . Each cell is colored based on the detected level of the predicted metabolite.

References

    1. Sartor RB. Mechanisms of disease: Pathogenesis of Crohn's disease and ulcerative colitis. Nature Clin Practice Gastroenterol & Hepatology. 2006;3:390–407. - PubMed
    1. Willing B, Halfvarson J, Dicksved J, Rosenquist M, Jarnerot G, et al. Twin studies reveal specific imbalances in the mucosa-associated microbiota of patients with ileal Crohn's disease. Inflamm Bowel Dis. 2009;15:653–660. - PubMed
    1. Nicholson JK, Holmes E, Wilson ID. Gut microorganisms, mammalian metabolism and personalized health care. Nature Rev Microbiol. 2005;3:431–438. - PubMed
    1. Wikoff WR, Anfora AT, Liu J, Schultz PG, Lesley SA, et al. Metabolomics analysis reveals large effects of gut microflora on mammalian blood metabolites. Proc Natl Acad Sci U S A. 2009;106:3698–3703. - PMC - PubMed
    1. Li M, Wang B, Zhang M, Rantalainen M, Wang S, et al. Symbiotic gut microbes modulate human metabolic phenotypes. Proc Natl Acad Sci U S A. 2008;105:2117–2122. - PMC - PubMed

Publication types

Substances