. 2009 Aug 21;9(16):2348-55.
doi: 10.1039/b902292a. Epub 2009 Jun 10.

Elongation and migration of single DNA molecules in microchannels using oscillatory shear flows

Affiliations

Elongation and migration of single DNA molecules in microchannels using oscillatory shear flows

Kyubong Jo et al. Lab Chip. .

Abstract

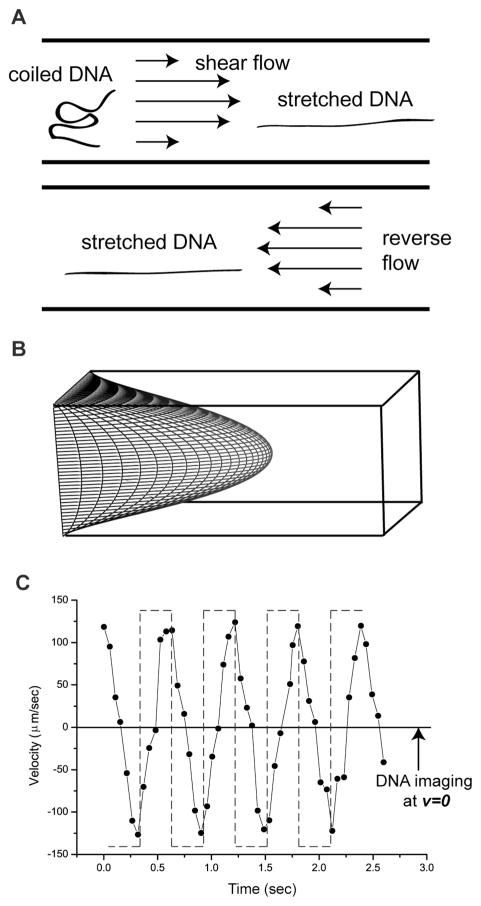
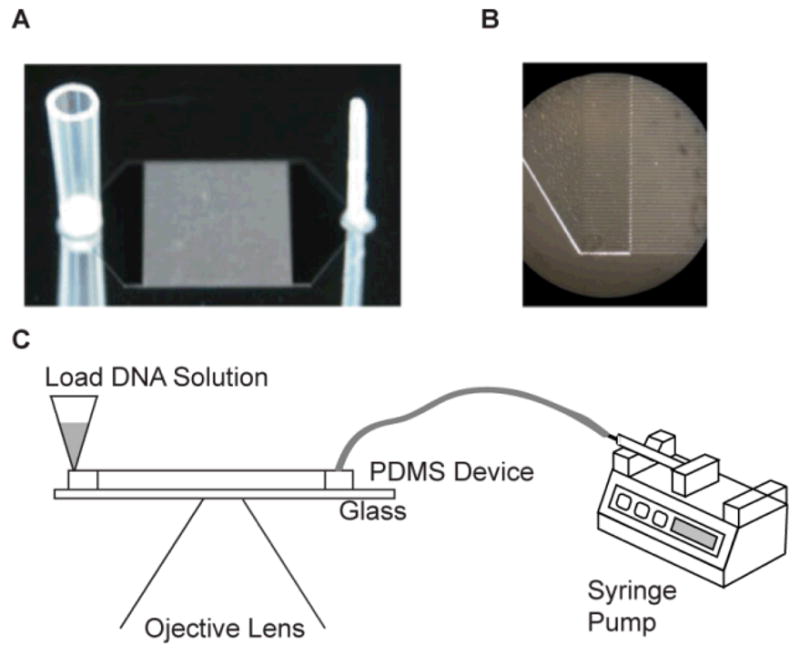
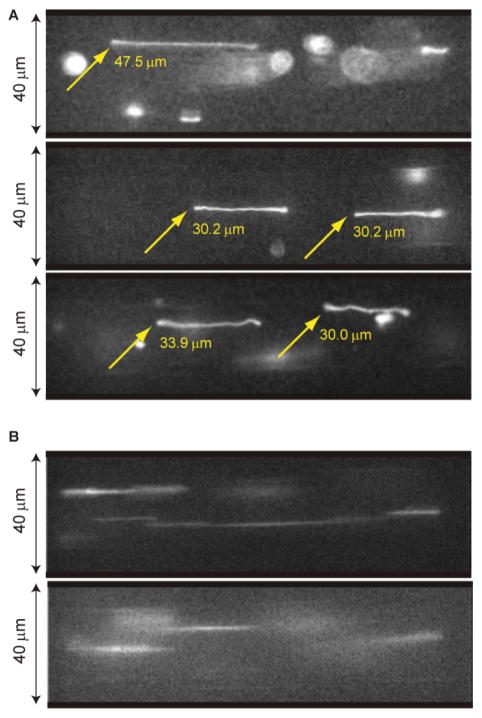
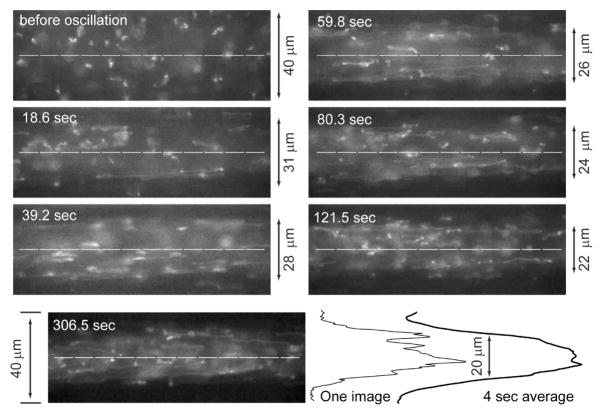
Much of modern biology relies on the strategic manipulation of molecules for creating ordered arrays prior to high throughput molecular analysis. Normally, DNA arrays involve deposition on surfaces, or confinement in nanochannels; however, we show that microfluidic devices can present stretched molecules within a controlled flow in ways complementing surface modalities, or extreme confinement conditions. Here we utilize pressure-driven oscillatory shear flows generated in microchannels as a new way of stretching DNA molecules for imaging "arrays" of individual DNA molecules. Fluid shear effects both stretch DNA molecules and cause them to migrate away from the walls becoming focused in the centerline of a channel. We show experimental findings confirming simulations using Brownian dynamics accounting for hydrodynamic interactions between molecules and channel-flow boundary conditions. Our findings characterize DNA elongation and migration phenomena as a function of molecular size, shear rate, oscillatory frequency with comparisons to computer simulation studies.


Figures

Fig. 1
Fig. 1. Oscillatory shear flow stretches DNA molecules
(A) Cartoon of DNA elongation by shear flows in a microchannel. Reverse flow maintains a DNA’s elongated conformation in a laminar flow and locks molecules within the same imaging plane (B) Parabolic shear flow profile in a square channel calculated and using MATLAB using equation (5) in the Experimental section. (C) Fluid velocities (forward “+”; backward “−“), under oscillatory flow were estimated by time-lapse imaging of a fluorescent bead in a microchannel (60 μm × 40 μm × 8 mm driven by a 1.6 nL/sec in average, flow at 1.7 Hz (square wave; dashed lines). The use of 40× objective (vs. 63×, or 100× used for other experiments) enabled a wider view of a fluorescent bead near the side wall. Measured fluid velocity compared to the driving frequency (dashed line) shows hysteresis effects and distortion.
Fig. 2
Fig. 2. Experimental Set-Up
(A) Photograph of a photoresist patterned silicon wafer used to mold silastic replica devices (not shown). Ports were directly molded into silastic devices by gluing a section of a wide bore pipette tip (left) and a Teflon tube (right) to the wafer; attached ports appear mirrored on the wafer. The ports connect via plenums to a rectangular (8 mm × 1 cm) array of 125, 8 mm long square channels [40μm × 40 μm; 40 μm separation]. (B) Close-up micrograph of image (A) detailing plenum/microchannels. (C) Schematic of experimental set-up on an optical microscope. A syringe pump connected to the smaller port (right) of the device controls fluid flow; DNA is loaded through the larger port (left).
Fig. 3
Fig. 3. DNA elongation under oscillatory shear flow
(A) Images of stretched T2 bacteriophage DNA molecules (164 kb; polymer contour length stained with YOYO-1 is ~71 μm) in microfluidic channels (40 μm × 40 μm) acquired during pauses in flow direction. (B) Images of rapidly moving DNA molecules. Images (A) and (B) are obtained from the same experiment: flow rate per channel is 0.4 nL/sec (effective shear rate γ̇ = 26.2 s−1) driven at 0.25 Hz. A CCD camera (CoolSNAP HQ, Roper Scientific) acquired images after 200 sec of oscillation; exposure time was 50 msec using pixel binning (4:1) for increasing the frame transfer rate to computer (binned mode 335 × 255 pixels; full mode 1392 × 1040 pixels)
Fig. 4
Fig. 4. T2 DNA migration in a microchannel (focusing) mediated by oscillatory flow
A series of micrographs, grabbed at different time points (S1 Movie), reveal progressive DNA migration; effective shear rate is 78.6 s−1 with an oscillation frequency of 0.25 Hz. Before oscillation (0 sec); random coil DNA molecules appear throughout the 40 μm-square channel; out-of-plane (image) coils appear as indistinct blobs of light. As oscillation proceeds, DNA depletion layers at walls flank well-stretched molecules; molecules at centerline (dashed lines). Image taken at 306.5 sec shows a well developed concentration profile with DNA molecules focused around the centerline. Since the fluorescence intensity profile from one image is noisy, frame averaging (4 sec; 75 images) results were used for measuring the full width, half maxima (FWHM) of the zone of DNA molecules surrounded by depletion layers; an example shows analysis of the 306.5 sec micrograph. In this experiment, a high DNA concentration was used for revealing DNA migration effects.
Fig. 5
Fig. 5. Fluorescence intensity profiles of progressive migration (focusing) of T2 DNA migration in a microchannel
The effective shear rate is 78.6 s−1 with an oscillation frequency of 0.25 Hz in 40 μm × 40 μm microchannels. Images (not shown) grabbed at the microchannel centerline for this analysis used a 100× objective. The profiles (see Experimental for details; offset for clarity) show the accumulation of molecules near the channel centerline; however, at 80 sec (bold line) a distinct dip forms at the centerline caused by DNA migration away from channel walls. The dip repeatedly vanishes and reappears even after a well-formed concentration profile is apparent.
Fig. 6
Fig. 6
Depletion layer dependence on Weissenberg number with comparison to simulation. Experimental data used three effective shear rates: 26.2 s−1, 78.6 s−1, and 157.2 s−1for T2 DNA (164 kb; Rg=1.6 μm;■) and λ DNA (48.5 kb; Rg=0.76 μm;□) in 40 μm × 40 μm × 8 mm channels. Combining two DNA sizes and three shear rates produces six data points on the plot: The Weissenberg numbers for T2 DNA ranges from 22–133 (τ = 0.85 sec), while λ DNA ranges from 2.5–15 (τ = 0.095 sec). Simulation (T2 DNA:●, λ DNA: ○) results consider a single coarse-grained polymer chain model of beads and springs using Brownian dynamics. A depletion layer thickness (Ld) is calculated from the full width, half-maximal dimensions of a fluorescence intensity profile. Error bars represent the maximum and minimal values on the means from 3–4 separate experiments and SD on the means for 60 simulation runs. Fluorescence intensity profiles were acquired across a channel (10 μm wide) after a consistent concentration profile was achieved (200–320 sec). Inset shows a log-log plot of experimental and simulation results, which are compared against the scaling relationship (Eq. 1; dotted line): Log(Ld/Rg)= (2/3)Log(Wi).
Fig. 7
Fig. 7. Depletion layer thickness vs. oscillatory frequency
Filled squares (■) represent data points obtained at 0.25 Hz, 0.5 Hz, and 1 Hz respectively with the shear rate of 157 s−1 (Wi=134; T2 DNA). Filled circles (●) represent computer simulation results by treating a single DNA molecule with Brownian dynamics without considering the delayed response of PDMS devices. Error bars represent the maximum and minimal values on the means from 3–4 separate experiments and SD on the means for 60 simulation runs. The depletion layer thickness (Ld) is the half-maximal width of fluorescence intensity profile. Higher frequency reduces depletion layers because shear strain experienced by DNA under oscillatory flow decreases as frequency increase. Also, the elastic property of PDMS device and plastic tubing reduces net shear strain. A quantitative measure of the depletion layer thickness (Ld) is calculated as the same method used in Fig. 6.

References

    1. Jo K, Dhingra DM, Odijk T, de Pablo JJ, Graham MD, Runnheim R, Forrest D, Schwartz DC. Proc Natl Acad Sci U S A. 2007;104:2673–2678. - PMC - PubMed
    1. Dimalanta ET, Lim A, Runnheim R, Lamers C, Churas C, Forrest DK, de Pablo JJ, Graham MD, Coppersmith SN, Goldstein S, Schwartz DC. Anal Chem. 2004;76:5293–5301. - PubMed
    1. Larson RG. Science. 2007;318:57–58. - PubMed
    1. Jendrejack RM, Dimalanta ET, Schwartz DC, Graham MD, de Pablo JJ. Phys Rev Lett. 2003:91. - PubMed
    1. Jendrejack RM, Schwartz DC, de Pablo JJ, Graham MD. J Chem Phys. 2004;120:2513–2529. - PubMed

Publication types