. 2009 Dec;27(3):569-90.
doi: 10.1007/s10827-009-0170-6. Epub 2009 Jul 28.

Crossover inhibition in the retina: circuitry that compensates for nonlinear rectifying synaptic transmission

Affiliations

Crossover inhibition in the retina: circuitry that compensates for nonlinear rectifying synaptic transmission

Alyosha Molnar et al. J Comput Neurosci. 2009 Dec.

Abstract

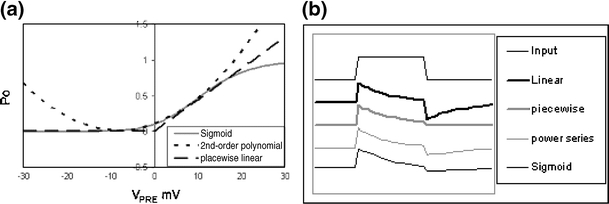
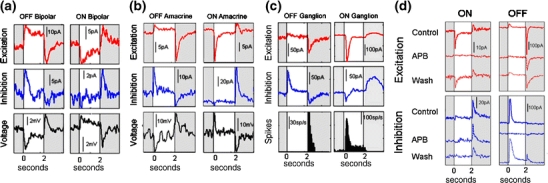
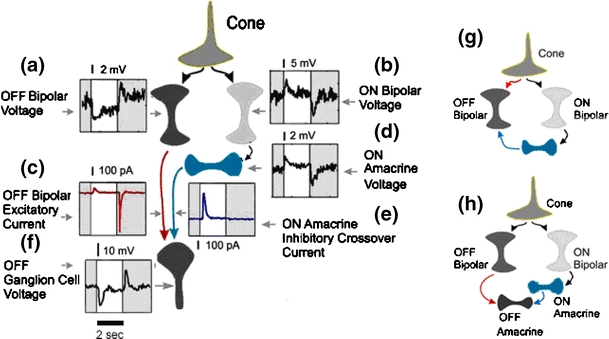
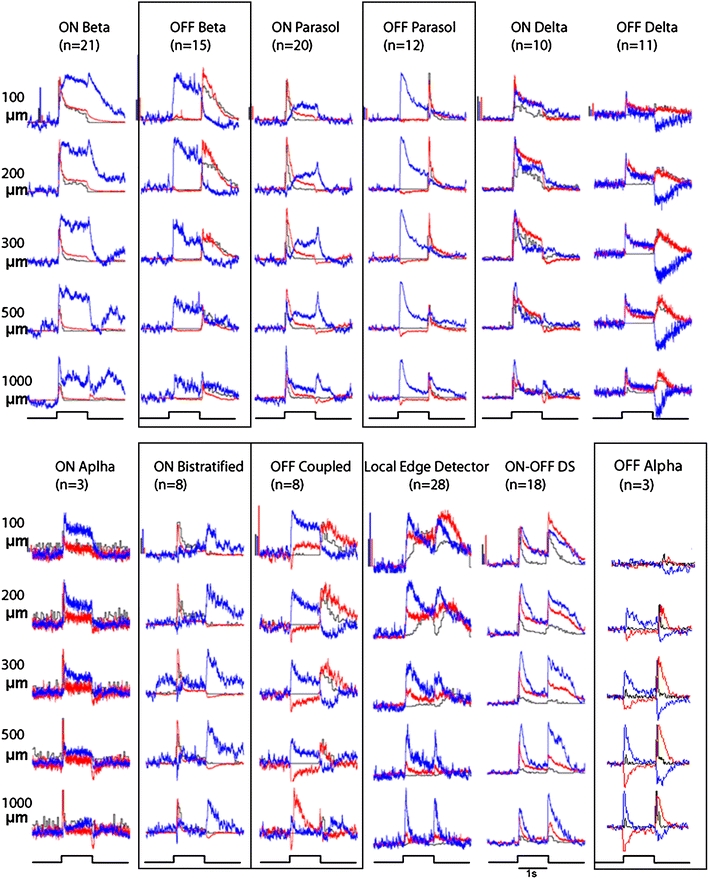
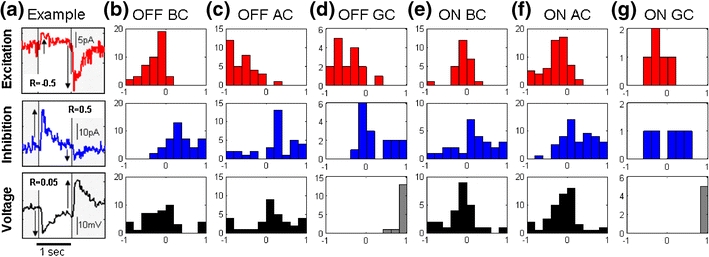
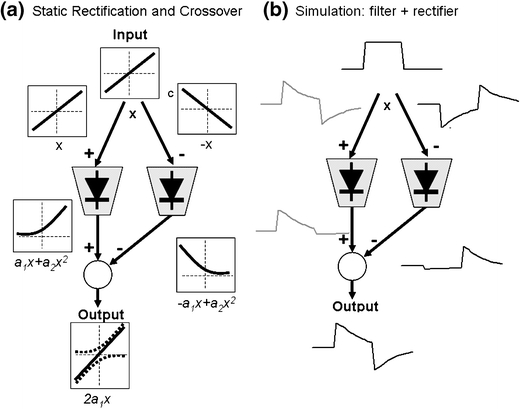
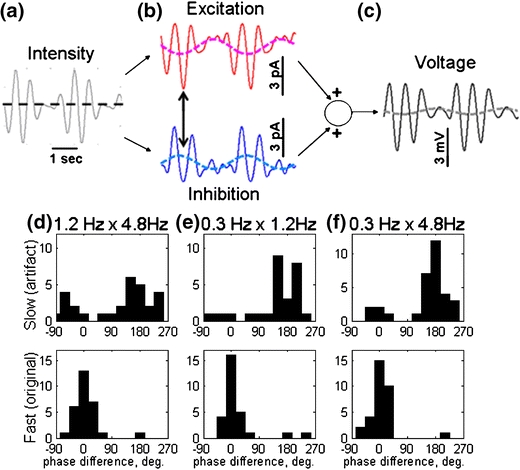
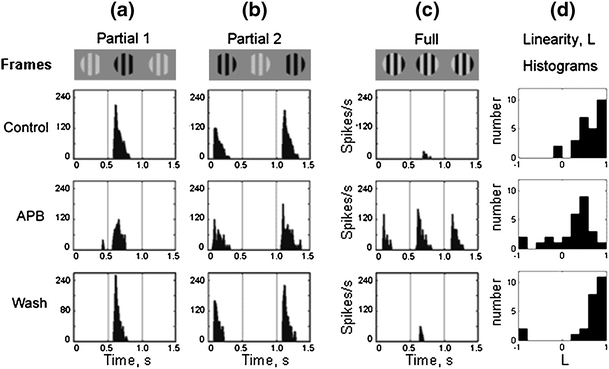
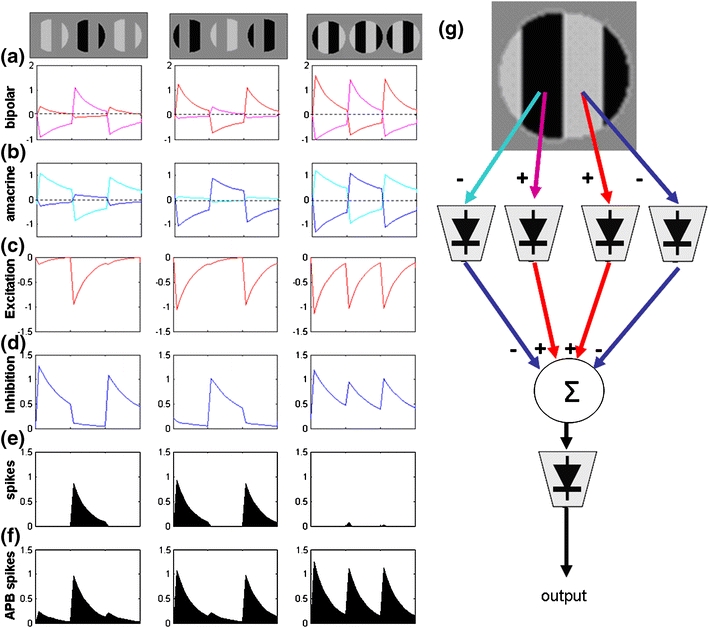
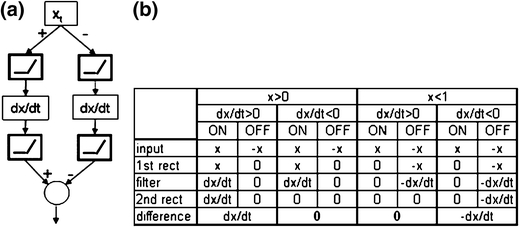
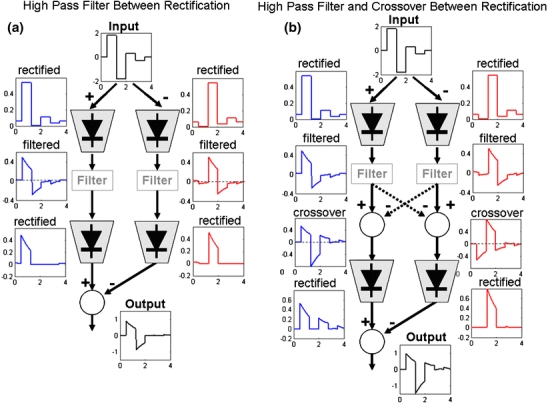
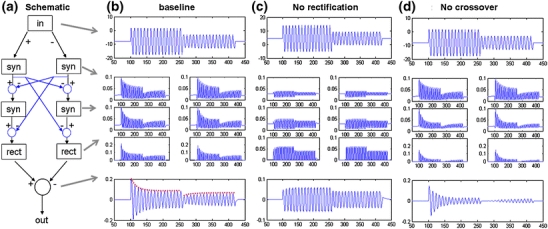
In the mammalian retina, complementary ON and OFF visual streams are formed at the bipolar cell dendrites, then carried to amacrine and ganglion cells via nonlinear excitatory synapses from bipolar cells. Bipolar, amacrine and ganglion cells also receive a nonlinear inhibitory input from amacrine cells. The most common form of such inhibition crosses over from the opposite visual stream: Amacrine cells carry ON inhibition to the OFF cells and carry OFF inhibition to the ON cells ("crossover inhibition"). Although these synapses are predominantly nonlinear, linear signal processing is required for computing many properties of the visual world such as average intensity across a receptive field. Linear signaling is also necessary for maintaining the distinction between brightness and contrast. It has long been known that a subset of retinal outputs provide exactly this sort of linear representation of the world; we show here that rectifying (nonlinear) synaptic currents, when combined thorough crossover inhibition can generate this linear signaling. Using simple mathematical models we show that for a large set of cases, repeated rounds of synaptic rectification without crossover inhibition can destroy information carried by those synapses. A similar circuit motif is employed in the electronics industry to compensate for transistor nonlinearities in analog circuits.


Figures

Fig. 1
Fig. 1
Comparison of 3 models of rectification: sigmoidal, polynomial and piecewise linear. (a) Static input-output models. (b)Responses when preceded by a linear band-pass filter
Fig. 2
Fig. 2
Crossover inhibition is a common property of bipolar, amacrine and ganglion cells. Excitatory (red, top row) and inhibitory (blue, middle row) currents were measured in example ON and OFF (a) bipolar, (b) amacrine and (c) ganglion cells in response to a stepped, bright flash. These inputs combine to generate the membrane voltage (bottom row) for bipolar (a) and amacrine (b) cells, or spiking rate (c, for ganglion cells) denoted in black. (d) Inclusion of L-AP4 in bath eliminates excitation but not inhibition to ON cells (in this case an amacrine cell) and inhibition but not excitation to OFF cells (in this case an OFF ganglion cell), indicating that the inhibition truly “crosses over”. Washing L-AP4 back out reverses these effects. Width of the white regions of each response block denote timing of the 2 s light flash
Fig. 3
Fig. 3
Signal flow of crossover inhibition to an OFF ganglion cell, in response to a 2 s light step (white portion of each frame). Likely behavior of presynaptic interneurons is illustrated with example traces. OFF bipolar cells (a) transiently hyperpolarize while ON bipolar cells (b) transiently depolarize at light ON, and both transiently polarize in the opposite direction at light OFF (black voltage traces). OFF bipolar cells generate an asymmetric inward excitatory post-synaptic current (c) in the OFF ganglion cell. ON bipolar cells excite ON amacrine cells (d) which generate an outward, inhibitory post-synaptic current (e) in the ganglion cell. These two currents are each strongly rectified but combine, in the absence of spiking, to generate a symmetric voltage signal in the OFF ganglion cell (f). Similar circuitry also appears in (g) bipolar (Molnar et al. 2002) and (h) amacrine cells(Hsueh et al. 2008). Red arrows indicate measured excitatory connections, blue arrows indicate inhibitory connections, black indicate presumptive presynaptic connections
Fig. 4
Fig. 4
Phase relationship between excitatory and inhibitory currents in (a,d) bipolar, (b,e) amacrine, and (c) ganglion cells receiving crossover inhibition. In each case the retina was stimulated by sinusoidally varying intensities of various frequencies, causing periodically varying excitatory and inhibitory currents (f)
Fig. 5
Fig. 5
Spatio-temporal responses of various Ganglion cell types to bright spots of diameter 100 μm, 200 μm, 300 μm, 500 μm, and 1000 μm (Roska et al. 2006). Each row is a given size, each column is a cell type. Average conductance for each cell type is shown (conductance is used rather than current to allow comparison of synaptic inputs in a compact format): red is excitation, blue is inhibition, scale bars are 1.6nS. Black is spiking (scale bar is 50spike/s), Responses enclosed in boxes are examples that show crossover inhibition. Note that the maximum amplitude of excitation and crossover inhibition occur for the same size spots
Fig. 6
Fig. 6
Quantifying rectification for excitation, inhibition and voltage (or spiking) with a rectification measure, R. (a) Example traces and R values for an OFF amacrine cell showing inward rectified excitatory and outward rectified inhibitory currents, which combine to generate a symmetric membrane voltage. Histograms of R for excitation, inhibition and voltage in (b-d) OFF and (e-g) ON cells, incorporating data from bipolar, amacrine and ganglion cells. Negative R values indicate inward rectification, positive values indicate outward rectification. Ganglion cells show spiking (which we recorded in lieu of voltage) which is itself rectified, and so masks the symmetry that might be expected in the voltage response
Fig. 7
Fig. 7
Simple model of rectification and crossover inhibition. (a) Effects of static nonlinearity on a differential circuit, each plot traces the signal vs input. (b) simple simulation where an input flash is subjected to high-pass filtering (adaptation) followed by rectification and crossover inhibition
Fig. 8
Fig. 8
Rectification confounds temporal contrast with brightness in an OFF bipolar cell: (a) A 1.2 Hz sinusoidally varying stimulus intensity that is amplitude-modulated by a slower, 0.3 Hz sinusoid. (b) Because of rectification, both excitatory and inhibitory inputs show a strong response at the 0.3 Hz envelope frequency (Dashed lines). (c) These envelope terms are out of phase and cancel, resulting in a more linear voltage response. d-f) Histograms of phase difference between excitation and inhibition at slow (envelope) and fast frequencies. Data was pooled across bipolar, amacrine and ganglion cells, and is shown for three combinations of fast- and slow-frequencies: 1.2 Hz × 4.8 Hz, 0.3 Hz × 1.2 Hz, and 0.3 Hz × 4.8 Hz
Fig. 9
Fig. 9
Crossover circuitry maintains linearity in the presence of high spatial contrast. Columns (a) and (b) show spiking histogram responses to partial gratings. Column c shows spiking histogram response of full grating where the bars of the grating invert so that there is no change in overall luminance at the receptive field center. The top of each column shows successive frames of the stimulus, in each case, back areas turn white, and white areas turn black, while grey areas maintain a constant, intermediate brightness. Control: Partial gratings elicit OFF responses in a and b, but minimal response to full grating in c. APB: Partial gratings still elicit OFF responses, but without ON crossover inhibition the full grating (c) also elicits a strong, nonlinear response. Wash: Linear behavior is restored to the full grating response in c. The gray images at the top of columns a-c each show three successive frames of the 0.5 sec/frame movie. Ordinate: spikes per second; abscissa time in seconds. (d) Histograms of linearity coefficient L with and without APB (histograms correspond to the same rows as (a-c)
Fig. 10
Fig. 10
Model of interaction of rectification, spatial averaging and crossover inhibition. (a,b) Stimulation of different regions stimulates different populations of bipolar cells (red vs pink) and amacrine cells (blue vs cyan). (c,d) These responses are rectified and summed in the ganglion cell, which combines the excitatory and inhibitory inputs, rectifies them, and generates a spiking input (e). When only one region is stimulated, excitation and inhibition do not interact, and excitation drives spiking, but when both regions are stimulated with opposite polarity, inhibition blocks excitation. If inhibition is removed (f) then the summed rectified excitation generates a nonlinear response. g) Schematic of the model used to generate (a-f)
Fig. 11
Fig. 11
(a) Schematic of rectification interleaved with derivative-base high-pass filters. (b) Chart of all possible scenarios: when the input and its derivative have opposite signs, no signal is transmitted
Fig. 12
Fig. 12
Numerical simulation of rectification interleaved with high pass filtering: (a) Without interleaved crossover, this leads to loss of information in the output; all traces plot signal level versus time. The input signal (top) is parsed into positive and negative replicas and rectified. These signals are then high-pass filtered and rectified again. Because rectification of the filtered signals occurs before the final crossover subtraction, several transitions in the latter part of the input do not appear in the output. (b) Simulations where crossover inhibition is included between rectifying stages. The input signal is parsed, rectified and filtered as in (a). These filtered signals are then cross-subtracted before they are rectified again. When these rectified signals are cross-subtracted (x) they generate an accurate high-passed version of the original input, representing every transition in input level
Fig. 13
Fig. 13
Model of rectifying, adapting synapses with crossover inhibition. (a) schematic of model, blocks labeled “syn” contain sigmoidal rectification plus adaptation, blue lines indicate crossover subtraction paths, and blocks labeled “rect” contain a piece-wise linear rectifier to model spike generation. To better reveal the various effects of the model the final output is taken to be the difference the two rectified pathways, essentially reconstructing a processed version of the input. (b) Baseline behavior at input, after each synapse, after spiking rectification, and after recombining paths. Response shows contrast adaptation without information loss (c) same as b, but with synapses biased into the linear part of sigmoid: contrast adaptation is lost. (d) Same as (b), but without crossover inhibition: adaptation is extreme, information is lost when contrast us reduced
Fig. 14
Fig. 14
Model calcium curve as well as expected gain and SNR (arbitrary scale). Peak gain and maximum linearity occur near F(V) = 0.5, peak SNR is always below this point

Similar articles

Cited by

References

    1. Anderson JS, Carandini M, Ferster D. Orientation tuning of input conductance, excitation, and inhibition in cat primary visual cortex. Journal of Neurophysiology. 2000;84:909–926. - PubMed
    1. Baccus SA, Meister M. Fast and slow contrast adaptation in retinal circuitry. Neuron. 2002;36:909–919. doi: 10.1016/S0896-6273(02)01050-4. - DOI - PubMed
    1. Beaudoin DL, Borghuis BG, Demb JB. Cellular basis for contrast gain control over the receptive field center of mammalian retinal ganglion cells. Journal of Neuroscience. 2007;27:2636–2645. doi: 10.1523/JNEUROSCI.4610-06.2007. - DOI - PMC - PubMed
    1. Chen EP, Linsenmeier RA. Centre components of cone-driven retinal ganglion cells: differential sensitivity to 2-amino-4-phosphonobutyric acid. Journal of Physiology. 1989;419:77–93. - PMC - PubMed
    1. Chen EP, Linsenmeier RA. Effects of 2-amino-4-phosphonobutyric acid on responsivity and spatial summation of X cells in the cat retina. Journal of Physiology. 1989;419:59–75. - PMC - PubMed