

An integration of complementary strategies for gene-expression analysis to reveal novel therapeutic opportunities for breast cancer
- PMID: 19638211
- PMCID: PMC2750116
- DOI: 10.1186/bcr2344
An integration of complementary strategies for gene-expression analysis to reveal novel therapeutic opportunities for breast cancer
Erratum in
- Breast Cancer Res. 2011;13(4):406
Abstract
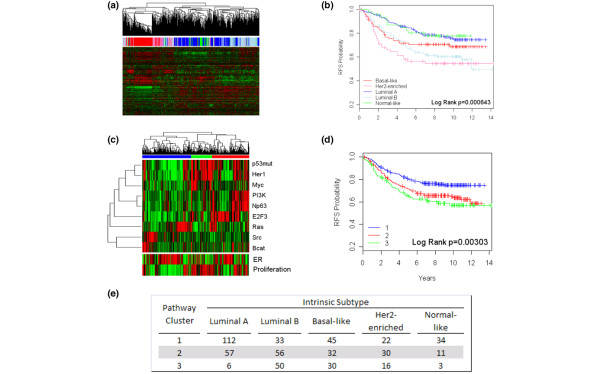
Introduction: Perhaps the major challenge in developing more effective therapeutic strategies for the treatment of breast cancer patients is confronting the heterogeneity of the disease, recognizing that breast cancer is not one disease but multiple disorders with distinct underlying mechanisms. Gene-expression profiling studies have been used to dissect this complexity, and our previous studies identified a series of intrinsic subtypes of breast cancer that define distinct populations of patients with respect to survival. Additional work has also used signatures of oncogenic pathway deregulation to dissect breast cancer heterogeneity as well as to suggest therapeutic opportunities linked to pathway activation.
Methods: We used genomic analyses to identify relations between breast cancer subtypes, pathway deregulation, and drug sensitivity. For these studies, we use three independent breast cancer gene-expression data sets to measure an individual tumor phenotype. Correlation between pathway status and subtype are examined and linked to predictions for response to conventional chemotherapies.
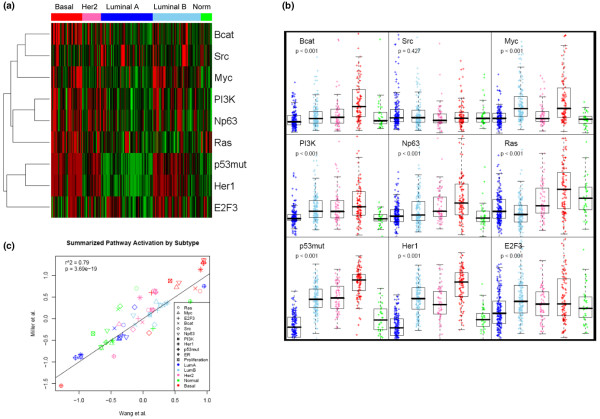
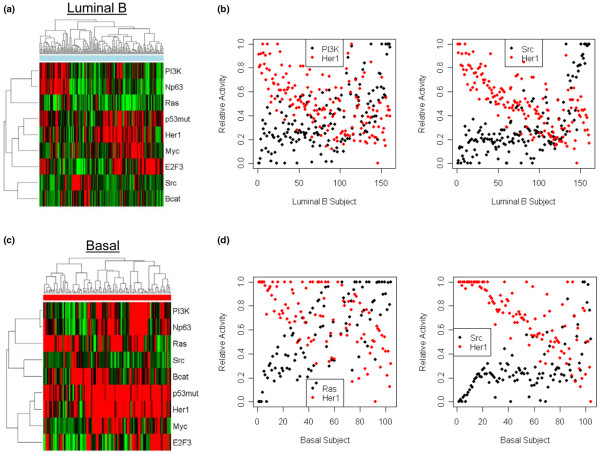
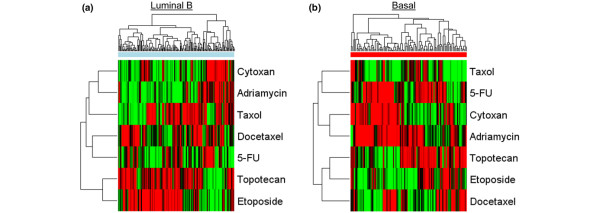
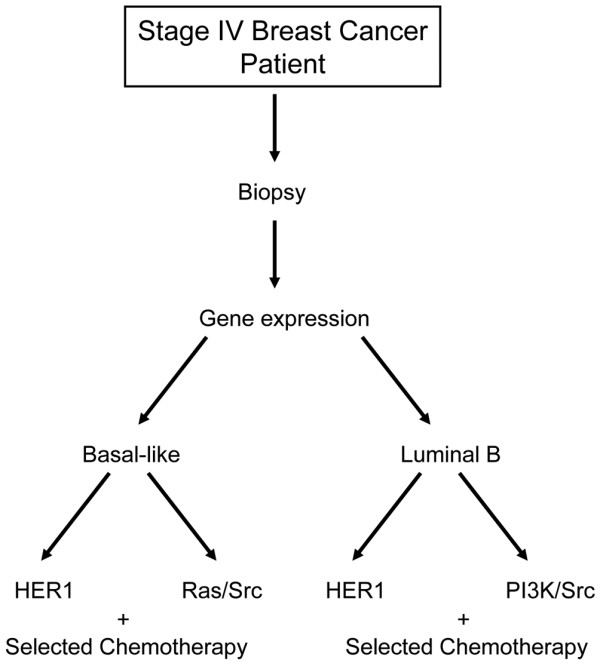
Results: We reveal patterns of pathway activation characteristic of each molecular breast cancer subtype, including within the more aggressive subtypes in which novel therapeutic opportunities are critically needed. Whereas some oncogenic pathways have high correlations to breast cancer subtype (RAS, CTNNB1, p53, HER1), others have high variability of activity within a specific subtype (MYC, E2F3, SRC), reflecting biology independent of common clinical factors. Additionally, we combined these analyses with predictions of sensitivity to commonly used cytotoxic chemotherapies to provide additional opportunities for therapeutics specific to the intrinsic subtype that might be better aligned with the characteristics of the individual patient.
Conclusions: Genomic analyses can be used to dissect the heterogeneity of breast cancer. We use an integrated analysis of breast cancer that combines independent methods of genomic analyses to highlight the complexity of signaling pathways underlying different breast cancer phenotypes and to identify optimal therapeutic opportunities.
Figures
References
-
- Sorlie T, Tibshirani R, Parker J, Hastie T, Marron JS, Nobel A, Deng S, Johnsen H, Pesich R, Geisler S, Demeter J, Perou CM, Lonning PE, Brown PO, Borresen-Dale AL, Botstein D. Repeated observation of breast tumor subtypes in independent gene expression data sets. Proc Natl Acad Sci USA. 2003;100:8418–8423. doi: 10.1073/pnas.0932692100. - DOI - PMC - PubMed
-
- Hu Z, Fan C, Oh DS, Marron JS, He X, Qaqish BF, Livasy C, Carey LA, Reynolds E, Dressler L, Nobel A, Parker J, Ewend MG, Sawyer LR, Wu J, Liu Y, Nanda R, Tretiakova M, Ruiz Orrico A, Dreher D, Palazzo JP, Perreard L, Nelson E, Mone M, Hansen H, Mullins M, Quackenbush JF, Ellis MJ, Olopade OI, Bernard PS, et al. The molecular portraits of breast tumors are conserved across microarray platforms. BMC Genomics. 2006;7:96. doi: 10.1186/1471-2164-7-96. - DOI - PMC - PubMed
-
- Black EP, Huang E, Dressman H, Rempel R, Laakso N, Asa SL, Ishida S, West M, Nevins JR. Distinct gene expression phenotypes of cells lacking Rb and Rb family members. Cancer Res. 2003;63:3716–3723. - PubMed
Publication types
MeSH terms
Substances
Grants and funding
LinkOut - more resources
Full Text Sources
Other Literature Sources
Medical
Research Materials
Miscellaneous
