. 2009 Jul 28:7:78.
doi: 10.1186/1477-7827-7-78.

LH pulse frequency and the emergence and growth of ovarian antral follicular waves in the ewe during the luteal phase of the estrous cycle

Affiliations

LH pulse frequency and the emergence and growth of ovarian antral follicular waves in the ewe during the luteal phase of the estrous cycle

Srinivas V Seekallu et al. Reprod Biol Endocrinol. .

Abstract

Background: In the ewe, ovarian antral follicles emerge or grow from a pool of 2-3 mm follicles in a wave like pattern, reaching greater than or equal to 5 mm in diameter before regression or ovulation. There are 3 or 4 such follicular waves during each estrous cycle. Each wave is preceded by a peak in serum FSH concentrations. The role of pulsatile LH in ovarian antral follicular emergence and growth is unclear; therefore, the purpose of the present study was to further define this role.

Methods: Ewes (n = 7) were given 200 ng of GnRH (IV) every hour for 96 h from Day 7 of the estrous cycle, to increase LH pulse frequency. Controls (n = 6) received saline. In a second study, ewes (n = 6) received subcutaneous progesterone-releasing implants for 10 days starting on Day 4 of the cycle, to decrease LH pulse frequency. Controls (n = 6) underwent sham surgery. Daily transrectal ovarian ultrasonography and blood sampling was performed on all ewes from the day of estrus to the day of ovulation at the end of the cycle of the study. At appropriate times, additional blood samples were taken every 12 minutes for 6 h and 36 min or 6 h in studies 1 and 2 respectively.

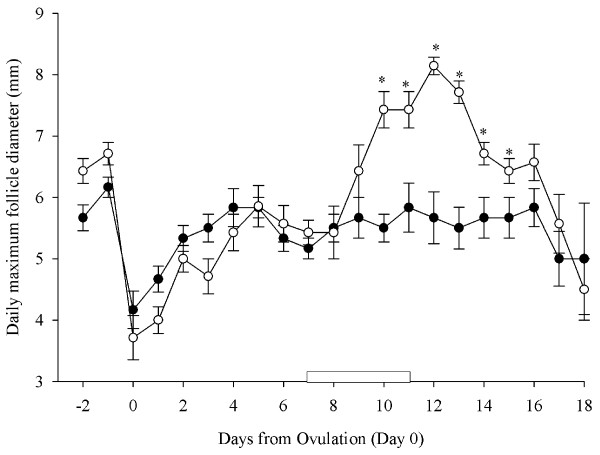
Results: The largest follicle of the follicular wave growing when GnRH treatment started, grew to a larger diameter than the equivalent wave in control ewes (P < 0.05). Mean serum estradiol and progesterone concentrations were higher but mean serum FSH concentrations were lower during GnRH treatment compared to control ewes (P < 0.05). The increased serum concentrations of estradiol and progesterone, in GnRH treated ewes, suppressed a peak in serum concentrations of FSH, causing a follicular wave to be missed. Treatment with progesterone decreased the frequency of LH pulses but did not have any influence on serum FSH concentrations or follicular waves.

Conclusion: We concluded that waves of ovarian follicular growth can occur at LH pulse frequencies lower than those seen in the luteal phase of the estrous cycle but frequencies seen in the follicular phase, when applied during the mid-luteal phase, in the presence of progesterone, do enhance follicular growth to resemble an ovulatory follicle, blocking the emergence of the next wave.


Figures

Figure 1
Figure 1
Schematic representation of the experimental designs used in the present study. In experiment 1, injections of GnRH (200 ng; IV) were given every hour for 96 h starting on Day 7 after ovulation (Day 0). In experiment 2, progesterone implants were inserted subcutaneously 4 days after ovulation and remained in place for 10 days. Control animals received saline or empty implants in experiment 1 and 2, respectively. Daily transrectal ovarian ultrasonography and blood sampling was performed on all ewes starting from the day when the ewe was marked with a vasectomized crayon-harnessed ram (estrus) until ovulation at the end of cycle. Blood samples were also taken every 12 minutes for 6 h (intensive bleeds) on Day 7, Day 9 and Day 11 after ovulation in experiment 1 and on Day 3, Day 10 and Day 16 in experiment 2, to characterize the pulsed secretion of LH and or FSH.
Figure 2
Figure 2
The characteristics of pulsatile LH secretion (mean and basal serum LH concentrations and LH pulse amplitude and frequency; mean ± SEM) determined from serum samples collected every 12 min for 6 h on Day 7 (black bars), Day 9 (light gray bars) and Day 11 (dark grey bars) after ovulation in cyclic Western White Face ewes. Starting on Day 7 after ovulation, ewes were treated with GnRH (200 ng; IV; treatment group) or saline (control group) every hour for 96 h. Letters (a-b) indicate differences between control ewes and ewes treated with GnRH (P < 0.001) within the respective intensive sampling period. Letters (x-y) indicate differences between the days of intensive blood sampling (P < 0.001) for control ewes or ewes treated with GnRH. [n = 6 (control), n = 7 (treatment)].
Figure 3
Figure 3
Mean (± S.E.M.) daily serum estradiol (Panel A) and progesterone concentrations (Panel B) over the entire experimental period in cyclic Western White Face ewes treated every hour for 96 h, with GnRH (200 ng; IV; open circles; n = 7) or saline (black circles; n = 6), starting on Day 7 after ovulation (Day 7–11; indicated by an open rectangular box on the X-axis). Data were normalized to the day of ovulation (Day 0) in all ewes. Asterisks (*) indicate differences between ewes treated with GnRH and control ewes (P < 0.001).
Figure 4
Figure 4
Mean (± S.E.M.) serum FSH concentrations determined from serum samples collected every 12 min for 6 h on Day 7 (top panel), Day 9 (middle panel) and Day 11 (bottom panel) after ovulation in cyclic Western White Face ewes treated every hour for 96 h, with GnRH (200 ng; IV; open circles; n = 7) or saline (black circles; n = 6), starting on Day 7 after ovulation.
Figure 5
Figure 5
Peaks in serum concentrations of FSH (outlined with shading) and their associated emerging follicular waves in cyclic Western White Face ewes treated every hour for 96 h, with GnRH (200 ng; IV; bottom panel; n = 7) or saline (top panel; n = 6), starting on Day 7 after ovulation (Day 7–11; indicated by an open rectangular box on the X-axis). Data were normalized to the day of ovulation (Day 0) in all ewes. Concentrations of FSH and follicle diameters are expressed as mean ± S.E.M. The average curves representing the growth, static and regression phases of all ewes in a group were normalized for each follicle wave to the mean day of wave emergence (indicated by the arrows; [36]). All FSH peaks for all ewes are shown normalized to the mean day of occurrence of the apex of the FSH peak for each wave. Although most follicular waves emerge at the zenith of the FSH peak, emergence can occur one day before or after the zenith of the FSH peak. For every FSH peak, serum concentration profiles were delimited by the encompassing nadirs of the FSH concentrations (hence the overlap of the data for adjacent peaks in some cases).
Figure 6
Figure 6
Mean (± S.E.M.) daily maximum follicle diameter over the entire experimental period in cyclic Western White Face ewes treated every hour for 96 h, with GnRH (200 ng; IV; open circles; n = 7) or saline (black circles; n = 6), starting on Day 7 after ovulation (Day 7–11; indicated by an open rectangular box on the X-axis). Data were normalized to the day of ovulation (Day 0) in all ewes. Asterisks (*) indicate differences amongst ewes treated with GnRH and control ewes (P < 0.001).
Figure 7
Figure 7
Mean (± S.E.M.) daily serum progesterone concentrations over the entire experimental period in cyclic Western White Face ewes treated for 10 d, from Day 4 after ovulation (Day 4–14; indicated by an open rectangular box on the X-axis) with silastic rubber implants (s.c) containing 10% progesterone (open circles; n = 6) and sham operated control ewes (black circles; n = 6). Data were normalized to the day of ovulation (Day 0) in all ewes. Asterisks (*) indicate differences between ewes treated with GnRH and control ewes (P < 0.001).
Figure 8
Figure 8
The characteristics of pulsatile LH secretion (mean and basal serum LH concentrations and LH pulse amplitude and frequency; mean ± SEM) determined from serum samples collected every 12 min for 6 h on Day 3 (black bars), Day 10 (light gray bars) and Day 16 (dark grey bars) after ovulation in cyclic Western White Face ewes. Ewes were treated for 10 d, from Day 4 after ovulation with silastic rubber implants (s.c) containing 10% progesterone (open circles; n = 6) and sham operated control ewes (black circles; n = 6). Letters (a-b) indicate differences between control ewes and ewes treated with progesterone releasing implants (P < 0.001) within respective intensive sampling period. Letters (x-y) indicate differences between the intensive blood sampling days (P < 0.001) for control ewes or ewes treated with progesterone releasing implants. [n = 6 (control), n = 6 (treatment)].
Figure 9
Figure 9
Peaks in serum concentrations of FSH (outlined with shading) and their associated emerging follicle waves in cyclic Western White Face ewes treated for 10 d, from Day 4 after ovulation (Day 4–14; indicated by an open rectangular box on the X-axis) with silastic rubber implants (s.c) containing 10% progesterone (bottom panel; n = 6) and sham operated control ewes (top panel; n = 6). Data were normalized to the day of ovulation (Day 0) in all ewes. Concentrations of FSH and follicle diameters are expressed as mean ± S.E.M. The average curves representing the growth, static and regression phases of all ewes in a group were normalized for each follicle wave to the mean day of wave emergence (indicated by the arrows; [38]). All FSH peaks for all ewes are shown normalized to the mean day of occurrence of the apex of the FSH peak for each wave. Although most follicular waves emerge at the zenith of the FSH peak, emergence can occur one day before or after the zenith of the FSH peak. For every FSH peak, serum concentration profiles were delimited by the encompassing nadirs of the FSH concentrations (hence the overlap of the data for adjacent peaks in some cases).

Similar articles

Cited by

References

    1. Ginther OJ, Kot K, Wiltbank MC. Associations between emergence of follicular waves and fluctuations in FSH concentrations during the estrous cycle in ewes. Theriogenology. 1995;43:689–703. doi: 10.1016/0093-691X(94)00074-5. - DOI - PubMed
    1. Bartlewski PM, Beard AP, Cook SJ, Chandolia RK, Honaramooz A, Rawlings NC. Ovarian antral follicular dynamics and their relationships with endocrine variables throughout the oestrous cycle in breeds of sheep differing in prolificacy. J Reprod Fertil. 1999;115:111–124. - PubMed
    1. Evans AC, Duffy P, Hynes N, Boland MP. Waves of follicle development during the estrous cycle in sheep. Theriogenology. 2000;53:699–715. doi: 10.1016/S0093-691X(99)00268-X. - DOI - PubMed
    1. Schrick FN, Surface RA, Pritchard JY, Dailey RA, Townsend EC, Inskeep EK. Ovarian structures during the estrous cycle and early pregnancy in ewes. Biol Reprod. 1993;49:1133–1140. doi: 10.1095/biolreprod49.5.1133. - DOI - PubMed
    1. Souza CJ, Campbell BK, Baird DT. Follicular dynamics and ovarian steroid secretion in sheep during anoestrus. J Reprod Fertil. 1996;108:101–106. - PubMed

Publication types

LinkOut - more resources