Meta-Analysis
. 2009 Jul 29:7:36.
doi: 10.1186/1741-7015-7-36.

Systematic review of the relation between smokeless tobacco and cancer in Europe and North America

Affiliations
Meta-Analysis

Systematic review of the relation between smokeless tobacco and cancer in Europe and North America

Peter N Lee et al. BMC Med. .

Abstract

Background: Interest is rising in smokeless tobacco as a safer alternative to smoking, but published reviews on smokeless tobacco and cancer are limited. We review North American and European studies and compare effects of smokeless tobacco and smoking.

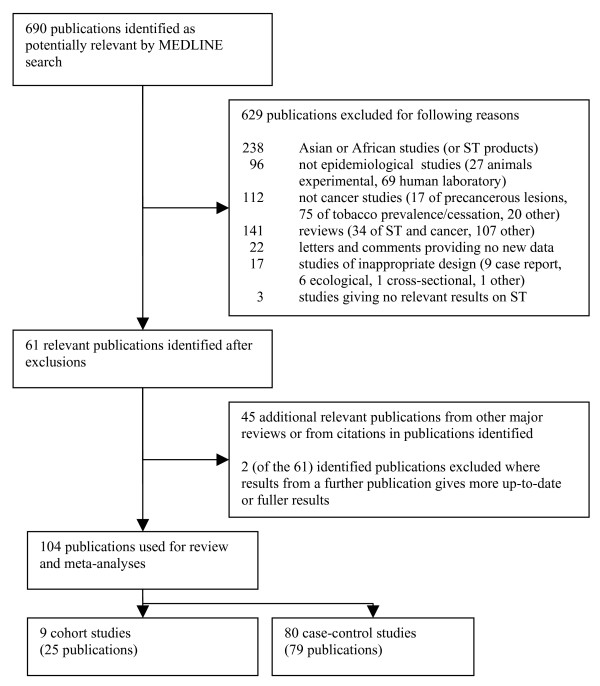
Methods: We obtained papers from MEDLINE searches, published reviews and secondary references describing epidemiological cohort and case-control studies relating any form of cancer to smokeless tobacco use. For each study, details were abstracted on design, smokeless tobacco exposure, cancers studied, analysis methods and adjustment for smoking and other factors. For each cancer, relative risks or odds ratios with 95% confidence intervals were tabulated. Overall, and also for USA and Scandinavia separately, meta-analyses were conducted using all available estimates, smoking-adjusted estimates, or estimates for never smokers. For seven cancers, smoking-attributable deaths in US men in 2005 were compared with deaths attributable to introducing smokeless tobacco into a population of never-smoking men.

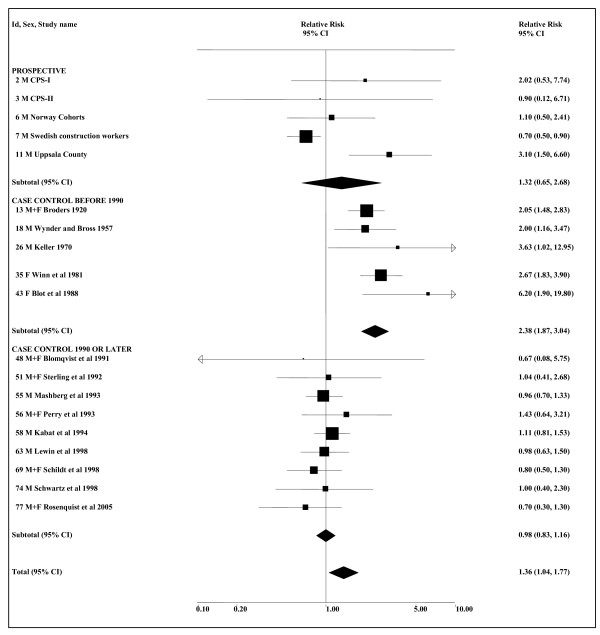
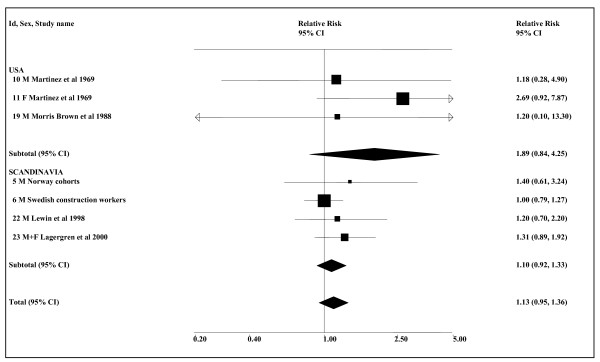
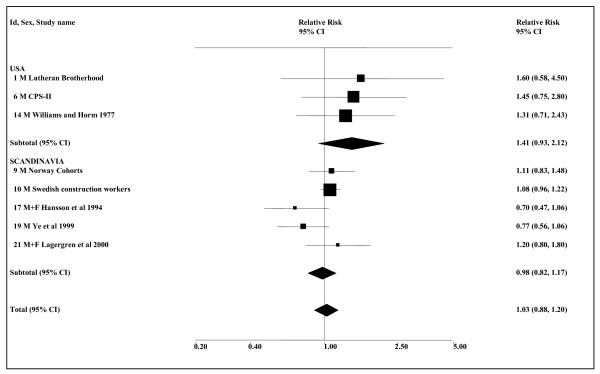
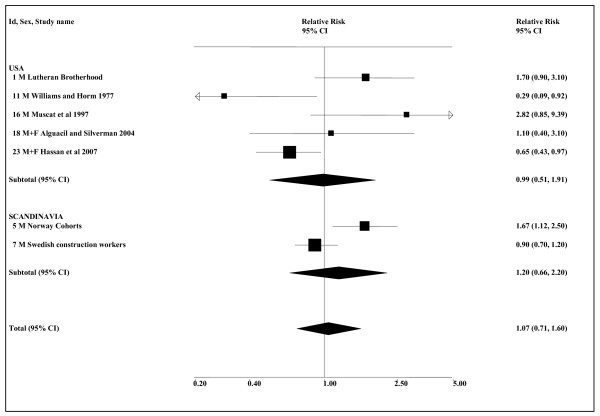
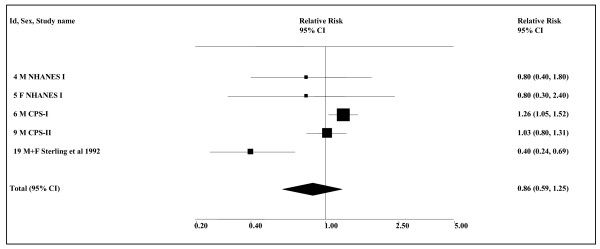
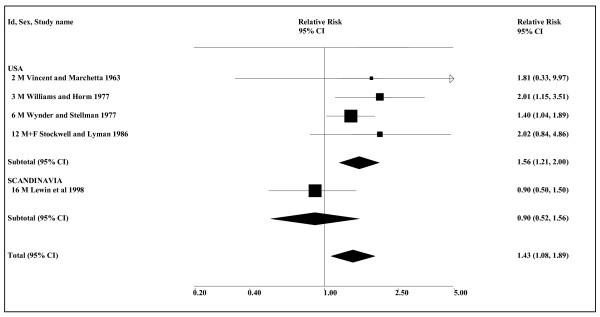
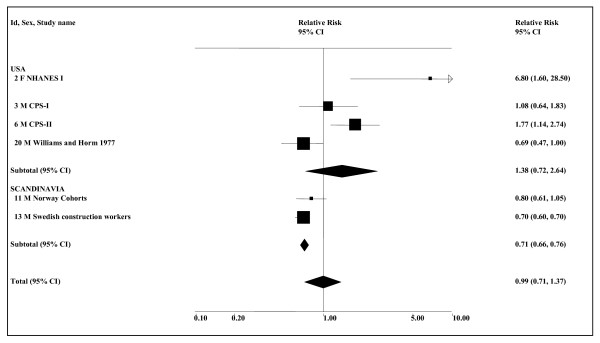
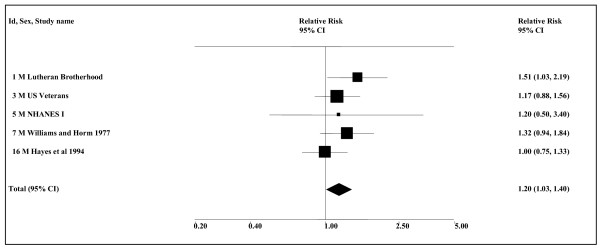
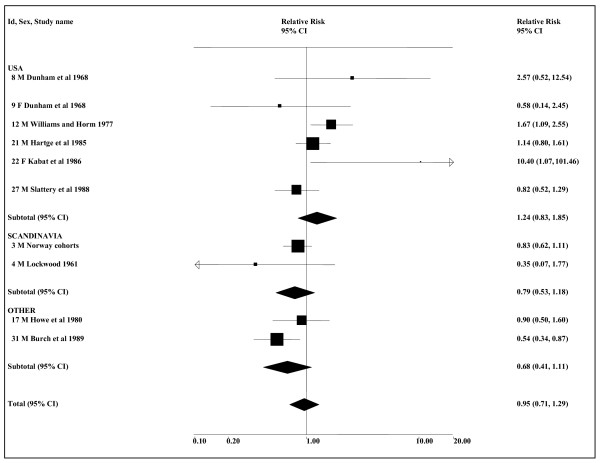
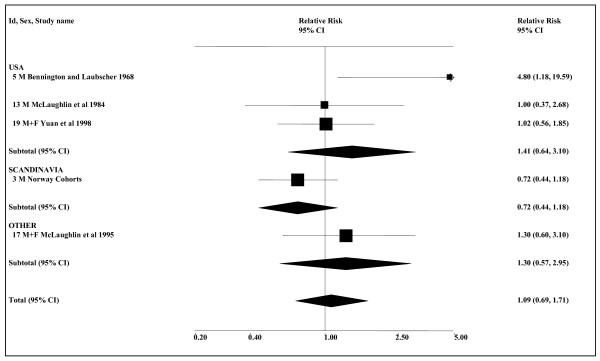
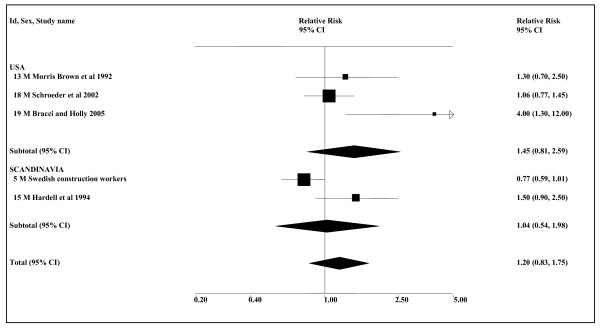
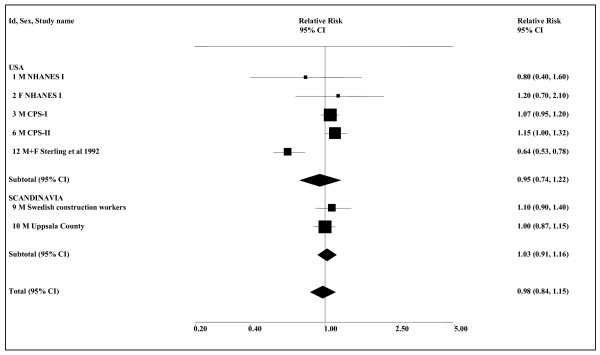
Results: Eighty-nine studies were identified; 62 US and 18 Scandinavian. Forty-six (52%) controlled for smoking. Random-effects meta-analysis estimates for most sites showed little association. Smoking-adjusted estimates were only significant for oropharyngeal cancer (1.36, CI 1.04-1.77, n = 19) and prostate cancer (1.29, 1.07-1.55, n = 4). The oropharyngeal association disappeared for estimates published since 1990 (1.00, 0.83-1.20, n = 14), for Scandinavia (0.97, 0.68-1.37, n = 7), and for alcohol-adjusted estimates (1.07, 0.84-1.37, n = 10). Any effect of current US products or Scandinavian snuff seems very limited. The prostate cancer data are inadequate for a clear conclusion.Some meta-analyses suggest a possible effect for oesophagus, pancreas, larynx and kidney cancer, but other cancers show no effect of smokeless tobacco. Any possible effects are not evident in Scandinavia. Of 142,205 smoking-related male US cancer deaths in 2005, 104,737 are smoking-attributable. Smokeless tobacco-attributable deaths would be 1,102 (1.1%) if as many used smokeless tobacco as had smoked, and 2,081 (2.0%) if everyone used smokeless tobacco.

Conclusion: An increased risk of oropharyngeal cancer is evident most clearly for past smokeless tobacco use in the USA, but not for Scandinavian snuff. Effects of smokeless tobacco use on other cancers are not clearly demonstrated. Risk from modern products is much less than for smoking.


Figures

Figure 1
Figure 1
Flow chart for search strategy for review of literature on smokeless tobacco and cancer. The flow chart shows the number of publications identified by the MEDLINE search, and the number excluded by reason. The number of additional publications identified from reviews and secondary references is also indicated, as is the total number of publications considered in the review and meta-analysis, subdivided by study type.
Figure 2
Figure 2
Smokeless tobacco and oropharyngeal cancer by study type and period of publication (smoking-adjusted data). The 19 individual smoking-adjusted relative risk (RR) and 95% confidence interval (CI) estimates separated by study type, and for case-control studies by period of publication, are shown numerically and also graphically on a logarithmic scale. They are sorted in order of year of publication. In the graphical representation individual RR estimates are indicated by a solid square, with the area of the square proportional to the weight (inverse-variance) of the estimate. Also shown are the combined estimates, for the subgroups and overall, derived by random-effects meta-analysis. These are represented by a diamond of standard height, with the width indicating the 95% CI. See Table 3 for further details relating to the estimates, and Table 4 for fuller details of the meta-analyses.
Figure 3
Figure 3
Smokeless tobacco and oesophageal cancer by region (smoking-adjusted data). The seven individual smoking-adjusted relative risk (RR) and 95% confidence interval (CI) estimates, separated by region, are shown numerically and also graphically on a logarithmic scale. They are sorted in order of year of publication within study type (cohort, case-control). In the graphical representation individual RR estimates are indicated by a solid square, with the area of the square proportional to the weight (inverse-variance) of the estimate. Also shown are the combined estimates, for the subgroups and overall, derived by random-effects meta-analysis. These are represented by a diamond of standard height, with the width indicating the 95% CI. See Table 5 for further details relating to the estimates, and Table 6 for fuller details of the meta-analyses.
Figure 4
Figure 4
Smokeless tobacco and stomach cancer by region (smoking-adjusted data). The eight individual smoking-adjusted relative risk (RR) and 95% confidence interval (CI) estimates, separated by region, are shown numerically and also graphically on a logarithmic scale. They are sorted in order of year of publication within study type (cohort, case-control). In the graphical representation individual RR estimates are indicated by a solid square, with the area of the square proportional to the weight (inverse-variance) of the estimate. Also shown are the combined estimates, for the subgroups and overall, derived by random-effects meta-analysis. These are represented by a diamond of standard height, with the width indicating the 95% CI. See Table 7 for further details relating to the estimates, and Table 8 for fuller details of the meta-analyses.
Figure 5
Figure 5
Smokeless tobacco and pancreatic cancer by region (smoking-adjusted data). The seven individual smoking-adjusted relative risk (RR) and 95% confidence interval (CI) estimates, separated by region, are shown numerically and also graphically on a logarithmic scale. They are sorted in order of year of publication within study type (cohort, case-control). In the graphical representation individual RR estimates are indicated by a solid square, with the area of the square proportional to the weight (inverse-variance) of the estimate. Also shown are the combined estimates, for the subgroups and overall, derived by random-effects meta-analysis. These are represented by a diamond of standard height, with the width indicating the 95% CI. See Table 9 for further details relating to the estimates, and Table 10 for fuller details of the meta-analyses.
Figure 6
Figure 6
Smokeless tobacco and overall digestive cancer (USA smoking-adjusted data). The five individual relative risk (RR) and 95% confidence interval (CI) estimates, all smoking-adjusted and for the USA, are shown numerically and also graphically on a logarithmic scale. They are sorted in order of year of publication within study type (cohort, case-control). In the graphical representation individual RR estimates are indicated by a solid square, with the area of the square proportional to the weight (inverse-variance) of the estimate. Also shown is the combined estimate, derived by random-effects meta-analysis. This is represented by a diamond of standard height, with the width indicating the 95% CI. See Table 11 for further details relating to the estimates, and Table 12 for fuller details of the meta-analysis.
Figure 7
Figure 7
Smokeless tobacco and larynx cancer by region (overall data). The five individual relative risk (RR) and 95% confidence interval (CI) estimates, separated by region, are shown numerically and also graphically on a logarithmic scale. They are sorted in order of year of publication within study type (cohort, case-control). In the graphical representation individual RR estimates are indicated by a solid square, with the area of the square proportional to the weight (inverse-variance) of the estimate. Also shown are the combined estimates, for the subgroups and overall, derived by random-effects meta-analysis. These are represented by a diamond of standard height, with the width indicating the 95% CI. See Table 13 for further details relating to the estimates, and Table 14 for fuller details of the meta-analyses. Only estimates 3 and 16 are smoking adjusted.
Figure 8
Figure 8
Smokeless tobacco and lung cancer by region (smoking-adjusted data). The six individual smoking-adjusted relative risk (RR) and 95% confidence interval (CI) estimates, separated by region, are shown numerically and also graphically on a logarithmic scale. They are sorted in order of year of publication within study type (cohort, case-control). In the graphical representation individual RR estimates are indicated by a solid square, with the area of the square proportional to the weight (inverse-variance) of the estimate. Also shown are the combined estimates, for the subgroups and overall, derived by random-effects meta-analysis. These are represented by a diamond of standard height, with the width indicating the 95% CI. See Table 15 for further details relating to the estimates, and Table 16 for fuller details of the meta-analyses.
Figure 9
Figure 9
Smokeless tobacco and prostate cancer (USA overall data). The five individual relative risk (RR) and 95% confidence interval (CI) estimates, all for the USA, are shown numerically and also graphically on a logarithmic scale. They are sorted in order of year of publication within study type (cohort, case-control). In the graphical representation individual RR estimates are indicated by a solid square, with the area of the square proportional to the weight (inverse-variance) of the estimate. Also shown are the combined estimates, for the subgroups and overall, derived by random-effects meta-analysis. These are represented by a diamond of standard height, with the width indicating the 95% CI. See Table 17 for further details relating to the estimates, and Table 18 for fuller details of the meta-analyses.
Figure 10
Figure 10
Smokeless tobacco and bladder cancer by region (smoking-adjusted data). The 10 individual smoking-adjusted relative risk (RR) and 95% confidence interval (CI) estimates, separated by region, are shown numerically and also graphically on a logarithmic scale. They are sorted in order of year of publication within study type (cohort, case-control). In the graphical representation individual RR estimates are indicated by a solid square, with the area of the square proportional to the weight (inverse-variance) of the estimate. Also shown are the combined estimates, for the subgroups and overall, derived by random-effects meta-analysis. These are represented by a diamond of standard height, with the width indicating the 95% CI. See Table 19 for further details relating to the estimates, and Table 20 for fuller details of the meta-analyses.
Figure 11
Figure 11
Smokeless tobacco and kidney cancer by region (smoking-adjusted data). The five individual smoking-adjusted relative risk (RR) and 95% confidence interval (CI) estimates, separated by region, are shown numerically and also graphically on a logarithmic scale. They are sorted in order of year of publication within study type (cohort, case-control). In the graphical representation individual RR estimates are indicated by a solid square, with the area of the square proportional to the weight (inverse-variance) of the estimate. Also shown are the combined estimates, for the subgroups and overall, derived by random-effects meta-analysis. These are represented by a diamond of standard height, with the width indicating the 95% CI. See Table 21 for further details relating to the estimates, and Table 22 for fuller details of the meta-analyses.
Figure 12
Figure 12
Smokeless tobacco and non-Hodgkin's lymphoma by region (overall data). The five individual relative risk (RR) and 95% confidence interval (CI) estimates, separated by region, are shown numerically and also graphically on a logarithmic scale. They are sorted in order of year of publication within study type (cohort, case-control). In the graphical representation individual RR estimates are indicated by a solid square, with the area of the square proportional to the weight (inverse-variance) of the estimate. Also shown are the combined estimates, for the subgroups and overall, derived by random-effects meta-analysis. These are represented by a diamond of standard height, with the width indicating the 95% CI. See Table 23 for further details relating to the estimates, and Table 24 for fuller details of the meta-analyses. Only estimates 5, 13 and 19 are smoking-adjusted.
Figure 13
Figure 13
Smokeless tobacco and overall cancer by region (smoking-adjusted data). The seven individual smoking-adjusted relative risk (RR) and 95% confidence interval (CI) estimates, separated by region, are shown numerically and also graphically on a logarithmic scale. They are sorted in order of year of publication within study type (cohort, case-control). In the graphical representation individual RR estimates are indicated by a solid square, with the area of the square proportional to the weight (inverse-variance) of the estimate. Also shown are the combined estimates, for the subgroups and overall, derived by random-effects meta-analysis. These are represented by a diamond of standard height, with the width indicating the 95% CI. See Table 26 for further details relating to the estimates, and Table 27 for fuller details of the meta-analyses.

Comment in

Similar articles

Cited by

References

    1. Critchley JA, Unal B. Health effects associated with smokeless tobacco: a systematic review. Thorax. 2003;58:435–443. doi: 10.1136/thorax.58.5.435. - DOI - PMC - PubMed
    1. International Agency for Research on Cancer. Smokeless tobacco and some tobacco-specific N-nitrosamines. [IARC Monographs on the evaluation of carcinogenic risks to humans.] Vol. 89. Lyon, France: IARC; 2007. http://monographs.iarc.fr/index.php - PMC - PubMed
    1. Scientific Committee on Emerging and Newly Identified Health Risks (SCENIHR) Health effects of smokeless tobacco products. Brussels: European Commission, Health & Consumer Protection Directorate-General; 2008. http://ec.europa.eu/health/ph_risk/committees/04_scenihr/docs/scenihr_o_...
    1. Weitkunat R, Sanders E, Lee PN. Meta-analysis of the relation between European and American smokeless tobacco and oral cancer. BMC Public Health. 2007;7:334. doi: 10.1186/1471-2458-7-334. - DOI - PMC - PubMed
    1. Sponsiello-Wang Z, Weitkunat R, Lee PN. Systematic review of the relation between smokeless tobacco and cancer of the pancreas in Europe and North America. BMC Cancer. 2008;8:356–368. doi: 10.1186/1471-2407-8-356. - DOI - PMC - PubMed