

Trovafloxacin enhances TNF-induced inflammatory stress and cell death signaling and reduces TNF clearance in a murine model of idiosyncratic hepatotoxicity
- PMID: 19638433
- PMCID: PMC2742585
- DOI: 10.1093/toxsci/kfp163
Trovafloxacin enhances TNF-induced inflammatory stress and cell death signaling and reduces TNF clearance in a murine model of idiosyncratic hepatotoxicity
Abstract
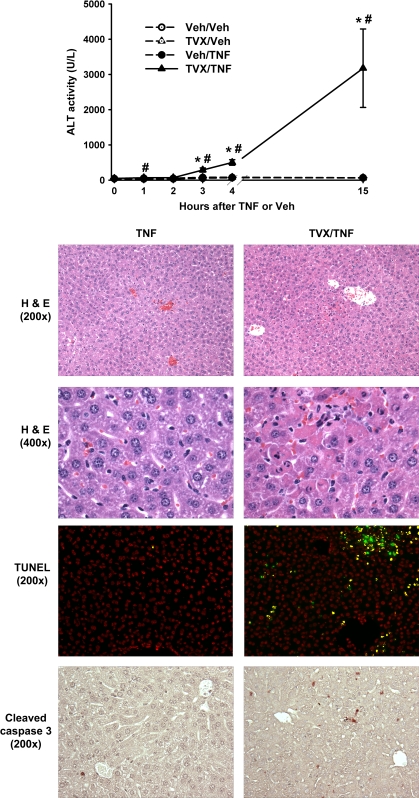
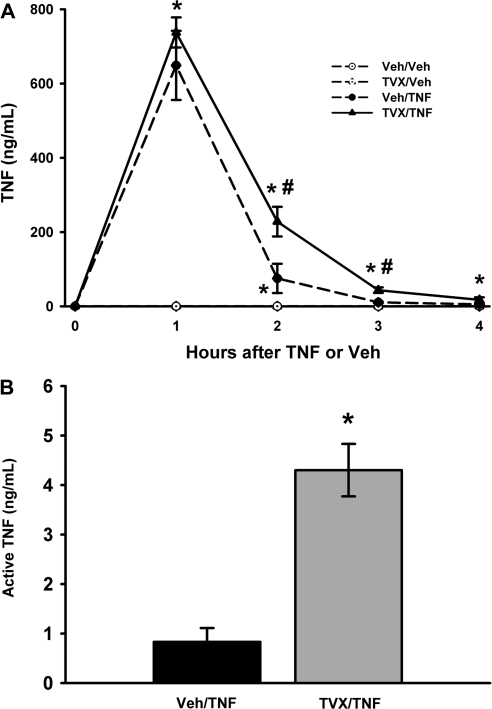
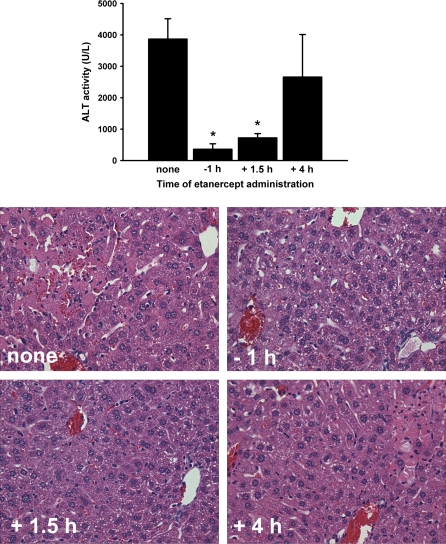
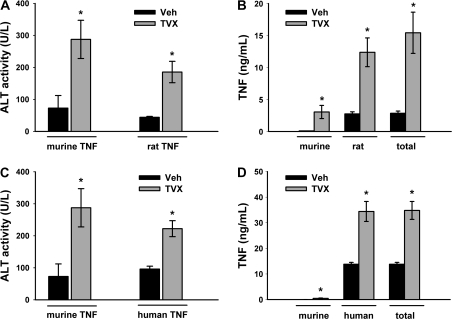
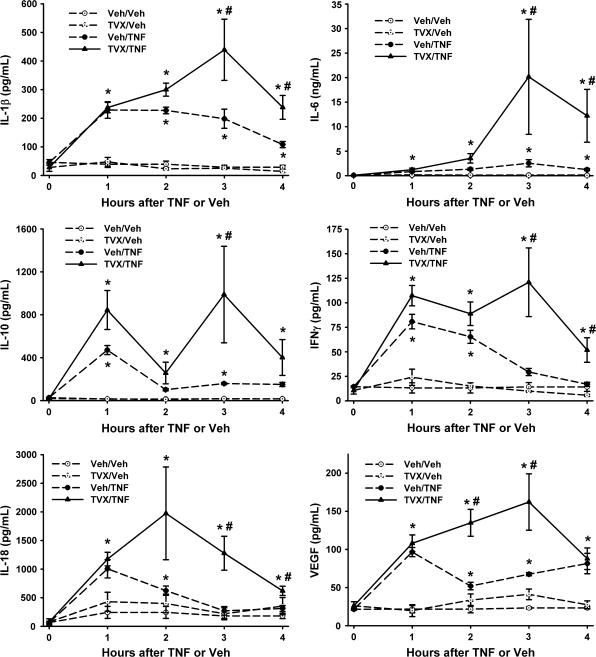
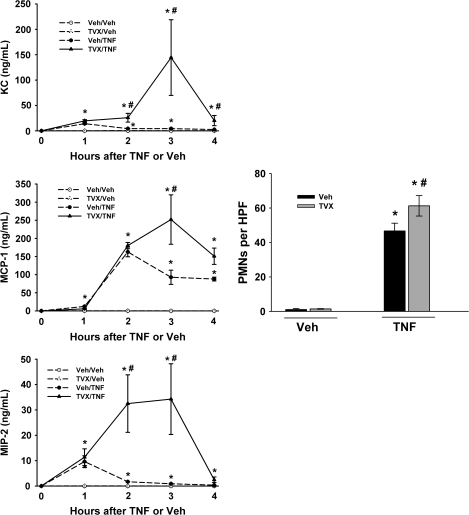
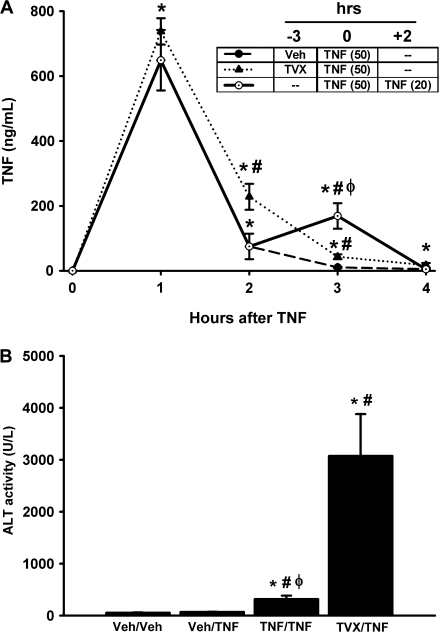
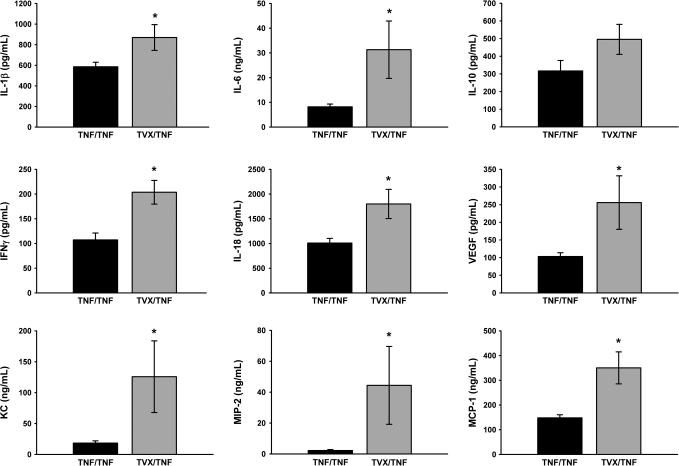
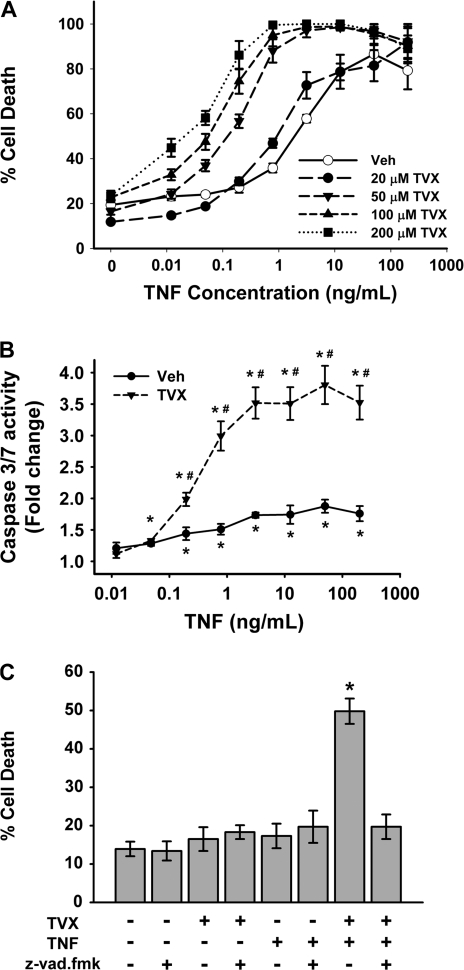
Therapy employing the fluoroquinolone antibiotic, trovafloxacin (TVX) was curtailed due to idiosyncratic hepatotoxicity. Previous studies in mice showed that a nonhepatotoxic inflammatory stress induced by tumor necrosis factor alpha (TNF) synergized with a nonhepatotoxic dose of TVX to cause liver injury. The purpose of this study was to explore mechanisms by which TVX interacts with TNF to cause liver injury. TVX pretreatment prolonged the peak of plasma TNF after its administration. This prolongation of TNF by TVX was critical to the development of hepatotoxicity. The prolongation of TNF concentration in plasma was primarily due to reduced clearance when compared with secondary biosynthesis. TNF is cleared from plasma by binding to soluble TNF receptors (TNFRs) which are eliminated by the kidney; however, the plasma concentrations of soluble TNFRs were not reduced, and biomarkers of renal dysfunction were not elevated in TVX/TNF-treated mice. Two injections of TNF mimicked the prolongation of the TNF peak by TVX and caused liver injury, but injury was less severe than after TVX/TNF coexposure. TVX enhanced the induction of proinflammatory cytokines by TNF. Additionally, TVX sensitized Hepa1c1c7 cells to TNF-induced killing in a concentration-dependent manner and increased both potency and efficacy of TNF to activate effector caspases that were critically involved in cell death from TVX/TNF coexposure. In summary, TVX reduced the clearance of TNF independent of either receptor shedding or kidney dysfunction. Additionally, TVX interacted with TNF to enhance inflammation and sensitize hepatocytes to TNF-induced cell death.
Figures

Similar articles
-
Tumor necrosis factor alpha is a proximal mediator of synergistic hepatotoxicity from trovafloxacin/lipopolysaccharide coexposure.J Pharmacol Exp Ther. 2009 Jan;328(1):62-8. doi: 10.1124/jpet.108.143792. Epub 2008 Sep 26. J Pharmacol Exp Ther. 2009. PMID: 18820134 Free PMC article.
-
Trovafloxacin-induced replication stress sensitizes HepG2 cells to tumor necrosis factor-alpha-induced cytotoxicity mediated by extracellular signal-regulated kinase and ataxia telangiectasia and Rad3-related.Toxicology. 2015 May 4;331:35-46. doi: 10.1016/j.tox.2015.03.002. Epub 2015 Mar 5. Toxicology. 2015. PMID: 25748550 Free PMC article.
-
Molecular mechanisms of hepatocellular apoptosis induced by trovafloxacin-tumor necrosis factor-alpha interaction.Toxicol Sci. 2014 Jan;137(1):91-101. doi: 10.1093/toxsci/kft226. Epub 2013 Oct 4. Toxicol Sci. 2014. PMID: 24097668 Free PMC article.
-
Idiosyncratic drug-induced liver injury and the role of inflammatory stress with an emphasis on an animal model of trovafloxacin hepatotoxicity.Toxicol Sci. 2010 Nov;118(1):7-18. doi: 10.1093/toxsci/kfq168. Epub 2010 Jun 10. Toxicol Sci. 2010. PMID: 20538741 Free PMC article. Review.
-
Idiosyncratic Drug-Induced Liver Injury: Is Drug-Cytokine Interaction the Linchpin?J Pharmacol Exp Ther. 2017 Feb;360(2):461-470. doi: 10.1124/jpet.116.237578. Epub 2016 Nov 15. J Pharmacol Exp Ther. 2017. PMID: 28104833 Review.
Cited by
-
Comparison of TNFα to lipopolysaccharide as an inflammagen to characterize the idiosyncratic hepatotoxicity potential of drugs: Trovafloxacin as an example.Int J Mol Sci. 2010 Nov 18;11(11):4697-714. doi: 10.3390/ijms11114697. Int J Mol Sci. 2010. PMID: 21151465 Free PMC article.
-
Trovafloxacin enhances lipopolysaccharide-stimulated production of tumor necrosis factor-α by macrophages: role of the DNA damage response.J Pharmacol Exp Ther. 2014 Jul;350(1):164-70. doi: 10.1124/jpet.114.214189. Epub 2014 May 9. J Pharmacol Exp Ther. 2014. PMID: 24817034 Free PMC article.
-
Trovafloxacin potentiation of lipopolysaccharide-induced tumor necrosis factor release from RAW 264.7 cells requires extracellular signal-regulated kinase and c-Jun N-Terminal Kinase.J Pharmacol Exp Ther. 2014 May;349(2):185-91. doi: 10.1124/jpet.113.211276. Epub 2014 Feb 13. J Pharmacol Exp Ther. 2014. PMID: 24525298 Free PMC article.
-
What have we learned from animal models of idiosyncratic, drug-induced liver injury?Expert Opin Drug Metab Toxicol. 2020 Jun;16(6):475-491. doi: 10.1080/17425255.2020.1760246. Epub 2020 May 4. Expert Opin Drug Metab Toxicol. 2020. PMID: 32324077 Free PMC article. Review.
-
Hepatic safety of antibiotics used in primary care.J Antimicrob Chemother. 2011 Jul;66(7):1431-46. doi: 10.1093/jac/dkr159. Epub 2011 May 17. J Antimicrob Chemother. 2011. PMID: 21586591 Free PMC article. Review.
References
-
- Bemelmans MH, Gouma DJ, Buurman WA. Influence of nephrectomy on tumor necrosis factor clearance in a murine model. J. Immunol. 1993a;150:2007–2017. - PubMed
-
- Bemelmans MH, Gouma DJ, Buurman WA. LPS-induced sTNF-receptor release in vivo in a murine model. Investigation of the role of tumor necrosis factor, IL-1, leukemia inhibiting factor, and IFN-gamma. J. Immunol. 1993b;151:5554–5562. - PubMed
-
- Bemelmans MH, Gouma DJ, Buurman WA. Tissue distribution and clearance of soluble murine TNF receptors in mice. Cytokine. 1994;6:608–615. - PubMed
-
- Bemelmans MH, van Tits LJ, Buurman WA. Tumor necrosis factor: Function, release and clearance. Crit. Rev. Immunol. 1996;16:1–11. - PubMed
-
- Beutler BA, Milsark IW, Cerami A. Cachectin/tumor necrosis factor: Production, distribution, and metabolic fate in vivo. J. Immunol. 1985;135:3972–3977. - PubMed
