

Sulindac metabolism and synergy with tumor necrosis factor-alpha in a drug-inflammation interaction model of idiosyncratic liver injury
- PMID: 19638570
- PMCID: PMC2766217
- DOI: 10.1124/jpet.109.156331
Sulindac metabolism and synergy with tumor necrosis factor-alpha in a drug-inflammation interaction model of idiosyncratic liver injury
Abstract
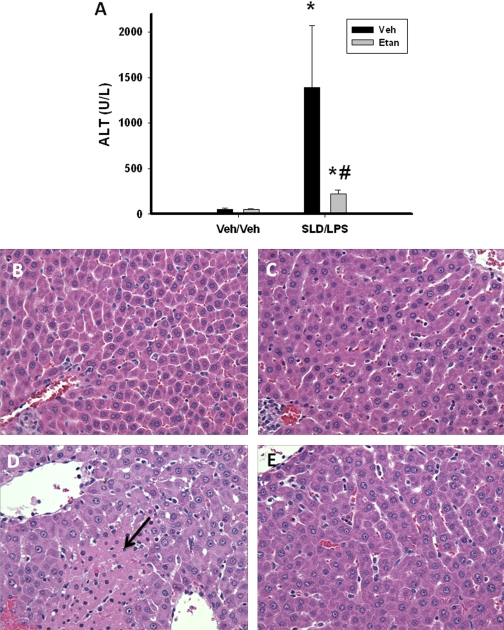
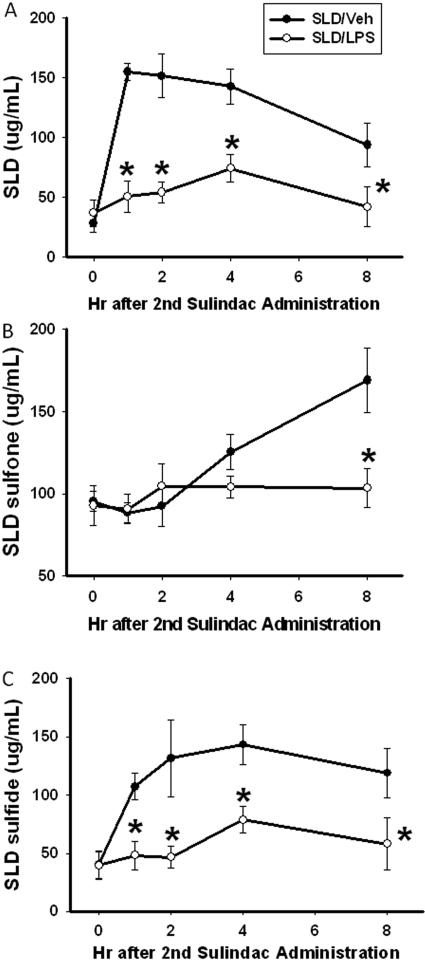
Sulindac (SLD) is a nonsteroidal anti-inflammatory drug (NSAID) that has been associated with a greater incidence of idiosyncratic hepatotoxicity in human patients than other NSAIDs. In previous studies, cotreatment of rats with SLD and a modestly inflammatory dose of lipopolysaccharide (LPS) led to liver injury, whereas neither SLD nor LPS alone caused liver damage. In studies presented here, further investigation of this animal model revealed that the concentration of tumor necrosis factor-alpha (TNF-alpha) in plasma was significantly increased by LPS at 1 h, and SLD enhanced this response. Etanercept, a soluble TNF-alpha receptor, reduced SLD/LPS-induced liver injury, suggesting a role for TNF-alpha. SLD metabolites in plasma and liver were determined by LC/MS/MS. Cotreatment with LPS did not increase the concentrations of SLD or its metabolites, excluding the possibility that LPS contributed to liver injury through enhanced exposure to SLD or its metabolites. The cytotoxicities of SLD and its sulfide and sulfone metabolites were compared in primary rat hepatocytes and HepG2 cells; SLD sulfide was more toxic in both types of cells than SLD or SLD sulfone. TNF-alpha augmented the cytotoxicity of SLD sulfide in primary hepatocytes and HepG2 cells. These results suggest that TNF-alpha can enhance SLD sulfide-induced hepatotoxicity, thereby contributing to liver injury in SLD/LPS-cotreated rats.
Figures


Similar articles
-
Oxidative stress is important in the pathogenesis of liver injury induced by sulindac and lipopolysaccharide cotreatment.Toxicology. 2010 Jun 4;272(1-3):32-8. doi: 10.1016/j.tox.2010.03.015. Epub 2010 Apr 3. Toxicology. 2010. PMID: 20371263 Free PMC article.
-
Hepatotoxic interaction of sulindac with lipopolysaccharide: role of the hemostatic system.Toxicol Sci. 2009 Mar;108(1):184-93. doi: 10.1093/toxsci/kfn259. Epub 2008 Dec 12. Toxicol Sci. 2009. PMID: 19074762 Free PMC article.
-
Neutrophil-cytokine interactions in a rat model of sulindac-induced idiosyncratic liver injury.Toxicology. 2011 Dec 18;290(2-3):278-85. doi: 10.1016/j.tox.2011.10.005. Epub 2011 Oct 14. Toxicology. 2011. PMID: 22019926 Free PMC article.
-
The role of tumor necrosis factor alpha in lipopolysaccharide/ranitidine-induced inflammatory liver injury.Toxicol Sci. 2007 Nov;100(1):267-80. doi: 10.1093/toxsci/kfm209. Epub 2007 Aug 13. Toxicol Sci. 2007. PMID: 17698507
-
Inflammatory stress and idiosyncratic hepatotoxicity: hints from animal models.Pharmacol Rev. 2009 Sep;61(3):262-82. doi: 10.1124/pr.109.001727. Pharmacol Rev. 2009. PMID: 19805476 Free PMC article. Review.
Cited by
-
Chlorpromazine-induced hepatotoxicity during inflammation is mediated by TIRAP-dependent signaling pathway in mice.Toxicol Appl Pharmacol. 2013 Feb 1;266(3):430-8. doi: 10.1016/j.taap.2012.11.030. Epub 2012 Dec 11. Toxicol Appl Pharmacol. 2013. PMID: 23238562 Free PMC article.
-
What have we learned from animal models of idiosyncratic, drug-induced liver injury?Expert Opin Drug Metab Toxicol. 2020 Jun;16(6):475-491. doi: 10.1080/17425255.2020.1760246. Epub 2020 May 4. Expert Opin Drug Metab Toxicol. 2020. PMID: 32324077 Free PMC article. Review.
-
Roles of Cofactors in Drug-Induced Liver Injury: Drug Metabolism and Beyond.Drug Metab Dispos. 2022 May;50(5):646-654. doi: 10.1124/dmd.121.000457. Epub 2022 Feb 27. Drug Metab Dispos. 2022. PMID: 35221288 Free PMC article. Review.
-
Trovafloxacin potentiation of lipopolysaccharide-induced tumor necrosis factor release from RAW 264.7 cells requires extracellular signal-regulated kinase and c-Jun N-Terminal Kinase.J Pharmacol Exp Ther. 2014 May;349(2):185-91. doi: 10.1124/jpet.113.211276. Epub 2014 Feb 13. J Pharmacol Exp Ther. 2014. PMID: 24525298 Free PMC article.
-
Oxidative stress is important in the pathogenesis of liver injury induced by sulindac and lipopolysaccharide cotreatment.Toxicology. 2010 Jun 4;272(1-3):32-8. doi: 10.1016/j.tox.2010.03.015. Epub 2010 Apr 3. Toxicology. 2010. PMID: 20371263 Free PMC article.
References
-
- Adamson GM, Billings RE. ( 1992) Tumor necrosis factor induced oxidative stress in isolated mouse hepatocytes. Arch Biochem Biophys 294: 223–229 - PubMed
-
- Adamson GM, Billings RE. ( 1993) Cytokine toxicity and induction of NO synthase activity in cultured mouse hepatocytes. Toxicol Appl Pharmacol 119: 100–107 - PubMed
-
- Beg AA, Baltimore D. ( 1996) An essential role for NF-kappaB in preventing TNF-alpha-induced cell death. Science 274: 782–784 - PubMed
-
- Bock JM, Menon SG, Goswami PC, Sinclair LL, Bedford NS, Jackson RE, Trask DK. ( 2007) Differential activity of sulindac metabolites against squamous cell carcinoma of the head and neck is mediated by p21waf1/cip1 induction and cell cycle inhibition. Cancer Biol Ther 6: 30–39 - PubMed
Publication types
MeSH terms
Substances
Grants and funding
LinkOut - more resources
Full Text Sources
Medical
