. 2009:5:290.
doi: 10.1038/msb.2009.47. Epub 2009 Jul 28.

Pathway databases and tools for their exploitation: benefits, current limitations and challenges

Affiliations

Pathway databases and tools for their exploitation: benefits, current limitations and challenges

Anna Bauer-Mehren et al. Mol Syst Biol. 2009.

Abstract

In past years, comprehensive representations of cell signalling pathways have been developed by manual curation from literature, which requires huge effort and would benefit from information stored in databases and from automatic retrieval and integration methods. Once a reconstruction of the network of interactions is achieved, analysis of its structural features and its dynamic behaviour can take place. Mathematical modelling techniques are used to simulate the complex behaviour of cell signalling networks, which ultimately sheds light on the mechanisms leading to complex diseases or helps in the identification of drug targets. A variety of databases containing information on cell signalling pathways have been developed in conjunction with methodologies to access and analyse the data. In principle, the scenario is prepared to make the most of this information for the analysis of the dynamics of signalling pathways. However, are the knowledge repositories of signalling pathways ready to realize the systems biology promise? In this article we aim to initiate this discussion and to provide some insights on this issue.


Conflict of interest statement

The authors declare that they have no conflict of interest.

Figures

Figure 1
Figure 1
EGFR map. EGFR map created using CellDesigner ver.2.0 (Oda et al, 2005). This map has been coloured to show the entities and reactions that are in common between the EGFR map and information found in Reactome. Red colour denotes that the entities and reactions are equivalent, purple connotes that they are similar but differ in some description details, and white is used for entities and reactions that could not be directly found in Reactome. In a second step, the map was extended by querying Reactome with key entities appearing in the EGFR map, which were missing in the representation of the EGFR pathway in Reactome. After this extension process, we coloured new equivalent entities in green and new similar entities (the ones that are differently described in both resources) in turquoise. For comparing the EGFR map with the pathways downloaded from Reactome, the Reactome pathways have been imported into Cytoscape and the entities and reactions have been manually compared using the node and edge search functions of Cytoscape. As the SBML version of the EGFR map does not contain unique identifiers for the nodes (species), all names have been first matched to Entrez Gene identifiers, which have then been used for comparing entities between the EGFR map and Reactome. In the extension process canonical names as well as Entrez Gene and UniProt identifiers have been used to retrieve all the information available in Reactome. In some cases, when no results were obtained in this way, the search was additionally expanded. For example, to find the EGFR crosstalk with the GPCR signalling, we additionally searched for ‘G protein'. GPCR signalling pathways activated by S1P1, S1P2/3, LPA1, LPA2, EP3 and EP2/4 were not found in Reactome. Instead, GPCR signalling through thrombin and glucagon receptors that are related to EGFR signalling (Prenzel et al, 1999; Buteau et al, 2003) are present in Reactome and were incorporated into the EGFR map to complete the missing crosstalk.
Figure 2
Figure 2
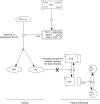
Comparison of ERK signalling as found in the EGFR map and in Reactome. In Reactome, ERK1 or ERK2 are phosphorylated by MKK1 or MKK2, respectively. The same reaction is found in the EGFR map, but here ERK1 and ERK2 are represented as a single entity, namely ERK1/2, which combines both proteins and can be phosphorylated by MKK1 and MKK2. In Reactome, dimerization and translocation to the nucleus are still separately described for each entity. Then, the representation switches from separate entities to one combined entity. In addition, the dissociation of MKK1 or MKK2, which is needed before the dimerization of ERK can take place, is not described in Reactome. Manual intervention is needed to correctly map both representations.
Figure 3
Figure 3
Example—annotation issue. The two reactions ‘Active PLCγ hydrolyses PI4,5-P2' (REACT_12078.2) and ‘IP3 binds with the IP3 receptor, opening the Ca2+ channel' (REACT_12008.1) are connected through the entity IP3 as the hydrolysis of PI4,5-P2 results in DAG and IP3, and then IP3 binds to its receptor enabling the Ca2+ release. However, the process in which IP3, located in the cytosol, translocates to the plasma membrane to bind to its receptor is not precisely described in Reactome, leading to differences in the annotation of both IP3 entities. This precludes the automated merging of both chains of reactions and manual intervention was needed to connect the reactions correctly.

Similar articles

Cited by

References

    1. Adriaens ME, Jaillard M, Waagmeester A, Coort SLM, Pico AR, Evelo CTA (2008) The public road to high-quality curated biological pathways. Drug Discov Today 13: 856–862 - PMC - PubMed
    1. Alberts B, Johnson A, Lewis J, Raff M, Roberts K, Walter P (2007) Molecular Biology of the Cell. New York, USA: Garland Science
    1. Alves R, Antunes F, Salvador A (2006) Tools for kinetic modeling of biochemical networks. Nat Biotechol 24: 667–672 - PubMed
    1. Amit I, Citri A, Shay T, Lu Y, Katz M, Zhang F, Tarcic G, Siwak D, Lahad J, Jacob-Hirsch J, Amariglio N, Vaisman N, Segal E, Rechavi G, Alon U, Mills GB, Domany E, Yarden Y (2007) A module of negative feedback regulators defines growth factor signaling. Nat Genet 39: 503–512 - PubMed
    1. Aoki-Kinoshita K, Kanehisa M (2007) KEGG Primer: An introduction to pathway analysis using KEGG, doi:10.1038/pid.2007.2. NCI-Nature Pathway Interaction Database

Publication types