Specification of progression in glaucomatous visual field loss, applying locally condensed stimulus arrangements
- PMID: 19639334
- PMCID: PMC2776145
- DOI: 10.1007/s00417-009-1134-2
Specification of progression in glaucomatous visual field loss, applying locally condensed stimulus arrangements
Abstract
Purpose: The goal of this work was to (i) determine patterns of progression in glaucomatous visual field loss, (ii) compare the detection rate of progression between locally condensed stimulus arrangements and conventional 6 degrees x 6 degrees grid, and (iii) assess the individual frequency distribution of test locations exhibiting a local event (i.e., an abrupt local deterioration of differential luminance sensitivity (DLS) by more than -10 dB between any two examinations).
Methods: The visual function of 41 glaucomatous eyes of 41 patients (16 females, 25 males, 37 to 75 years old) was examined with automated static perimetry (Tuebingen Computer Campimeter or Octopus 101-Perimeter). Stimuli were added to locally enhance the spatial resolution in suspicious regions of the visual field. The minimum follow-up was four subsequent sessions with a minimum of 2-month (median 6-month) intervals between each session. Progression was identified using a modified pointwise linear regression (PLR) method and a modified Katz criterion. The presence of events was assessed in all progressive visual fields.
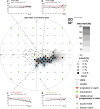
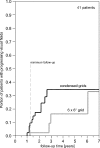
Results: Eleven eyes (27%) showed progression over the study period (median 2.5 years, range 1.3-8.6 years). Six (55%) of these had combined progression in depth and size and five eyes (45%) progressed in depth only. Progression in size conformed always to the nerve fiber course. Seven out of 11 (64%) of the progressive scotomata detected by spatially condensed grids would have been missed by the conventional 6 degrees x 6 degrees grid. At least one event occurred in 64% of all progressive eyes. Five of 11 (46%) progressive eyes showed a cluster of events.
Conclusions: The most common pattern of progression in glaucomatous visual fields is combined progression in depth and size of an existing scotoma. Applying individually condensed test grids remarkably enhances the detection rate of glaucomatous visual field deterioration (at the expense of an increased examination time) compared to conventional stimulus arrangements.
Figures


Similar articles
-
Spatial pattern of glaucomatous visual field loss obtained with regionally condensed stimulus arrangements.Invest Ophthalmol Vis Sci. 2010 Nov;51(11):5685-9. doi: 10.1167/iovs.09-5067. Epub 2010 Jun 10. Invest Ophthalmol Vis Sci. 2010. PMID: 20538998 Free PMC article.
-
Increased detection rate of glaucomatous visual field damage with locally condensed grids: a comparison between fundus-oriented perimetry and conventional visual field examination.Arch Ophthalmol. 2003 Apr;121(4):458-65. doi: 10.1001/archopht.121.4.458. Arch Ophthalmol. 2003. PMID: 12695242
-
Comparison of Visual Field Progression Rates Among the High Tension Glaucoma, Primary Angle Closure Glaucoma, and Normal Tension Glaucoma.Invest Ophthalmol Vis Sci. 2019 Mar 1;60(4):889-900. doi: 10.1167/iovs.18-25421. Invest Ophthalmol Vis Sci. 2019. PMID: 30835290
-
[Aiming for zero blindness].Nippon Ganka Gakkai Zasshi. 2015 Mar;119(3):168-93; discussion 194. Nippon Ganka Gakkai Zasshi. 2015. PMID: 25854109 Review. Japanese.
-
Outcomes of trabeculectomy for primary open-angle glaucoma.Ophthalmology. 1995 Dec;102(12):1760-9. doi: 10.1016/s0161-6420(95)30796-8. Ophthalmology. 1995. PMID: 9098275 Review.
Cited by
-
Detection of visual field progression in glaucoma with standard achromatic perimetry: a review and practical implications.Graefes Arch Clin Exp Ophthalmol. 2011 Nov;249(11):1593-616. doi: 10.1007/s00417-011-1787-5. Epub 2011 Aug 26. Graefes Arch Clin Exp Ophthalmol. 2011. PMID: 21870086 Review.
-
Spatial pattern of glaucomatous visual field loss obtained with regionally condensed stimulus arrangements.Invest Ophthalmol Vis Sci. 2010 Nov;51(11):5685-9. doi: 10.1167/iovs.09-5067. Epub 2010 Jun 10. Invest Ophthalmol Vis Sci. 2010. PMID: 20538998 Free PMC article.
-
Functional assessment of glaucoma: Uncovering progression.Surv Ophthalmol. 2020 Nov-Dec;65(6):639-661. doi: 10.1016/j.survophthal.2020.04.004. Epub 2020 Apr 26. Surv Ophthalmol. 2020. PMID: 32348798 Free PMC article. Review.
-
Comparing glaucoma progression on 24-2 and 10-2 visual field examinations.PLoS One. 2015 May 15;10(5):e0127233. doi: 10.1371/journal.pone.0127233. eCollection 2015. PLoS One. 2015. PMID: 25978316 Free PMC article.
-
Incorporating Spatial Models in Visual Field Test Procedures.Transl Vis Sci Technol. 2016 Mar 11;5(2):7. doi: 10.1167/tvst.5.2.7. eCollection 2016 Mar. Transl Vis Sci Technol. 2016. PMID: 26981329 Free PMC article.
References
-
- Budenz DL, Feuer WJ, Anderson DR. The effect of simulated cataract on the glaucomatous visual field. Ophthalmology. 1993;100:511–517. - PubMed
Publication types
MeSH terms
LinkOut - more resources
Full Text Sources
Miscellaneous

