. 2009 Jul 30;63(2):189-202.
doi: 10.1016/j.neuron.2009.07.004.

Mammalian Par3 regulates progenitor cell asymmetric division via notch signaling in the developing neocortex

Affiliations

Mammalian Par3 regulates progenitor cell asymmetric division via notch signaling in the developing neocortex

Ronald S Bultje et al. Neuron. .

Abstract

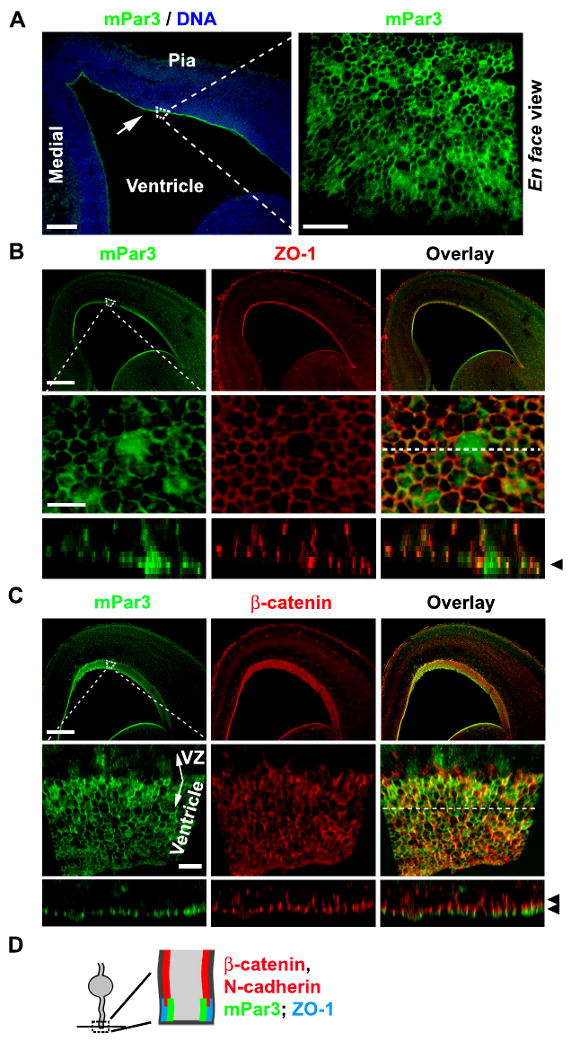
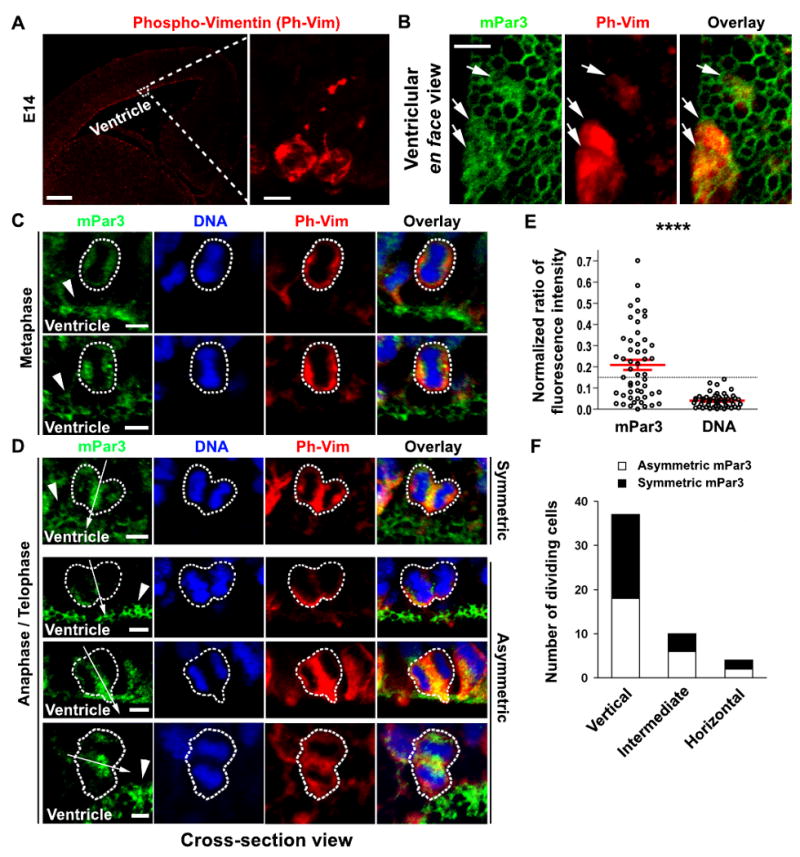
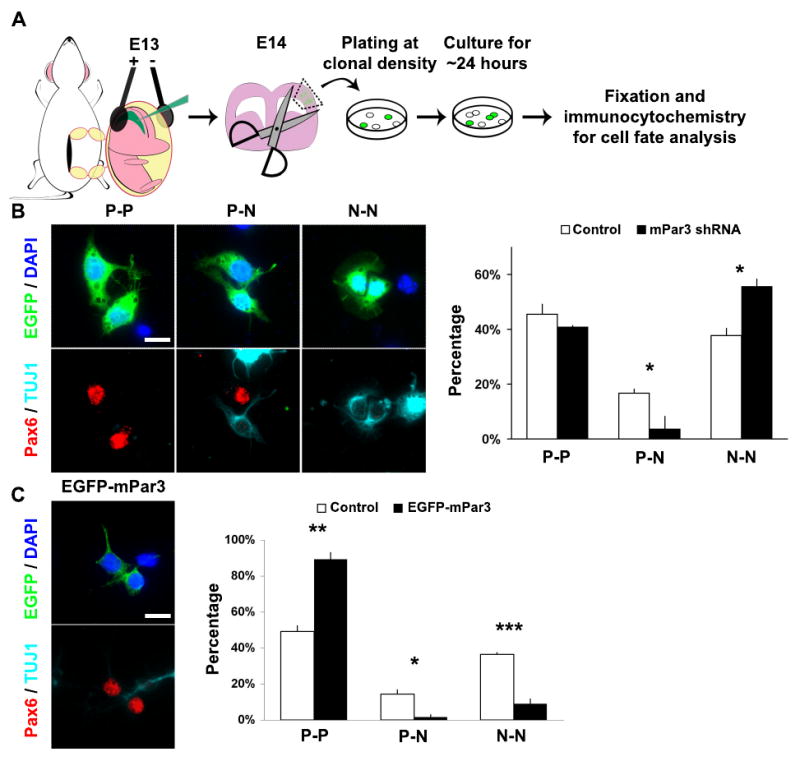
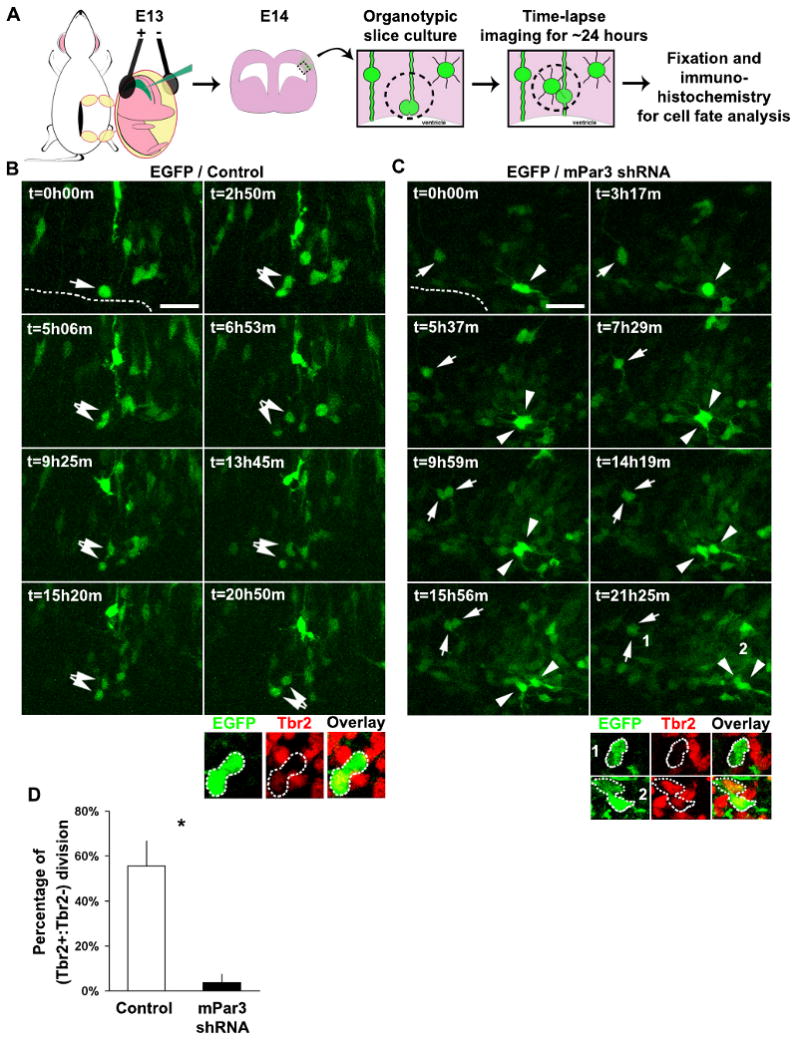
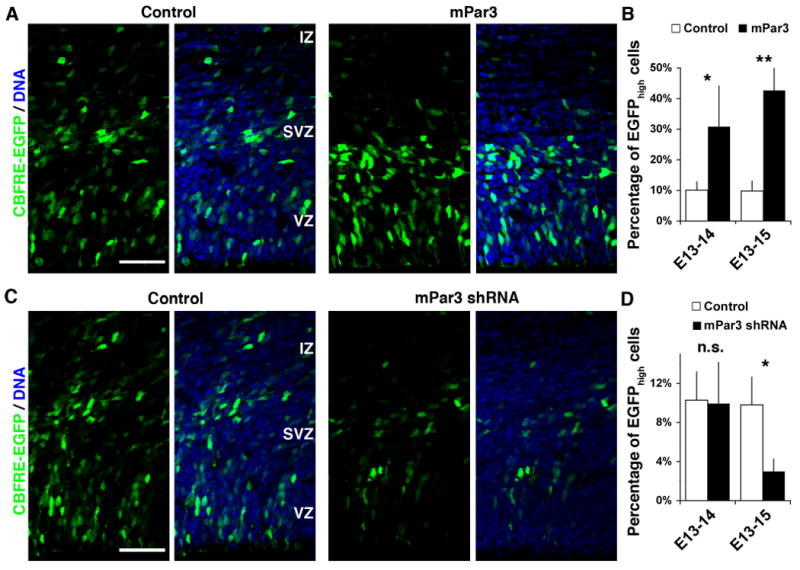
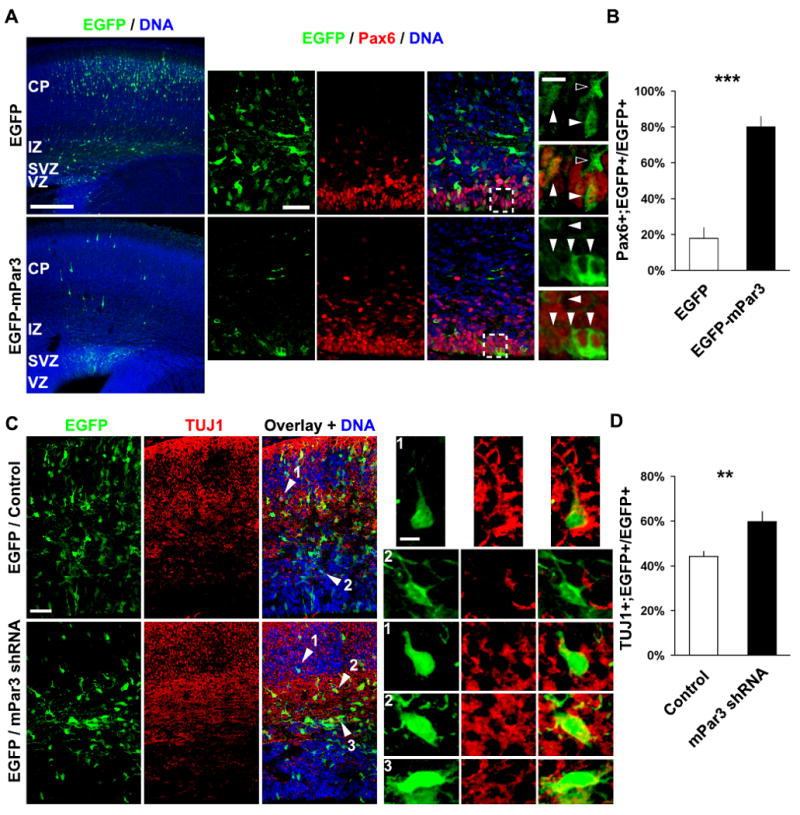
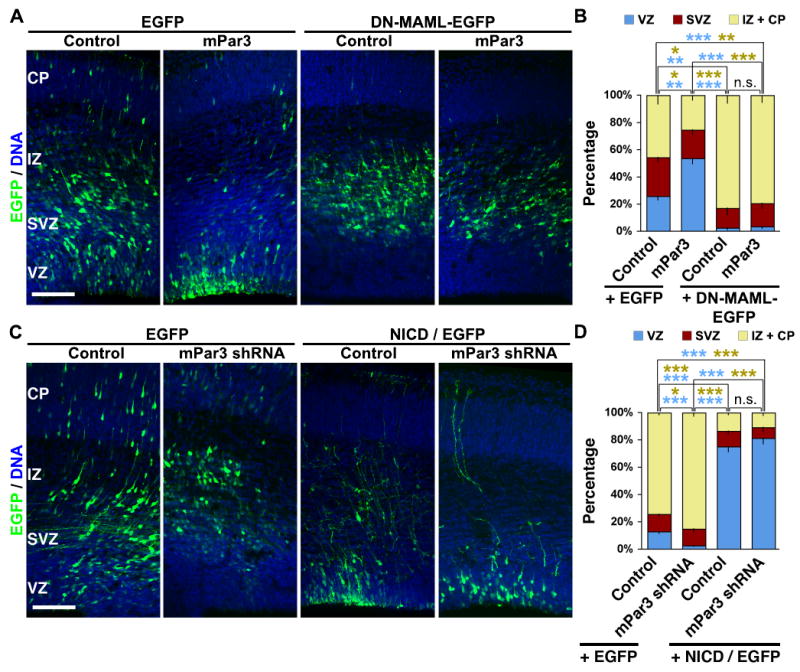
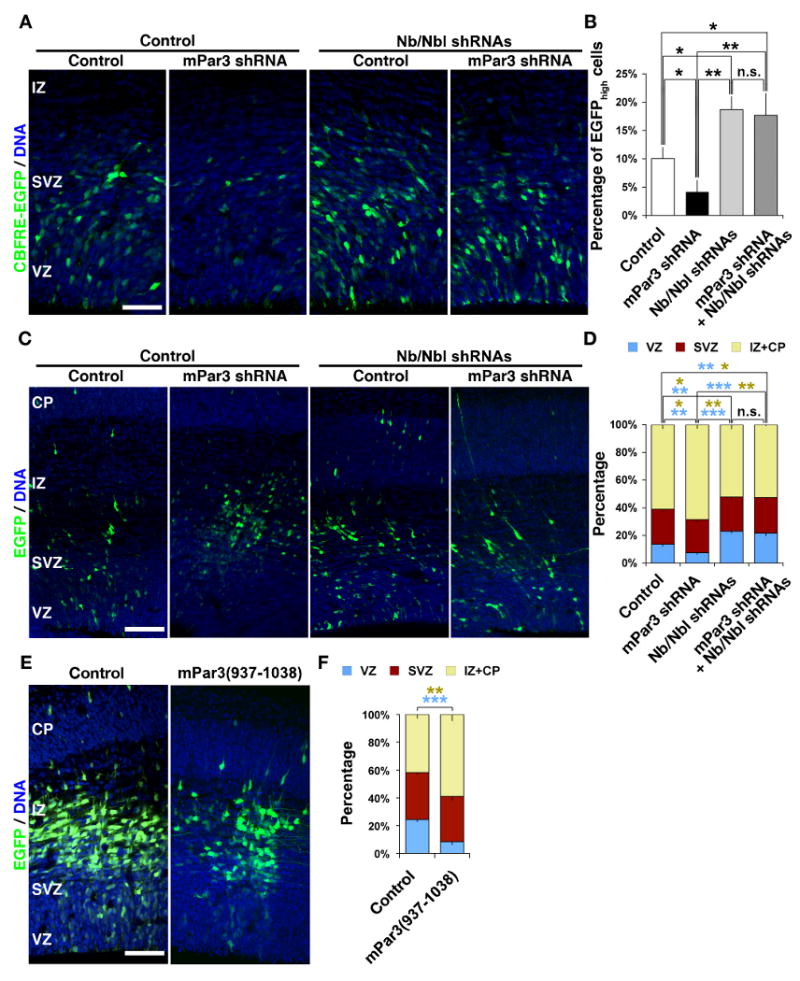
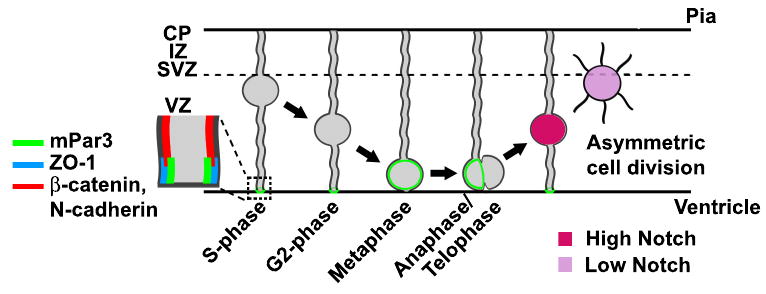
Asymmetric cell division of radial glial progenitors produces neurons while allowing self-renewal; however, little is known about the mechanism that generates asymmetry in daughter cell fate specification. Here, we found that mammalian partition defective protein 3 (mPar3), a key cell polarity determinant, exhibits dynamic distribution in radial glial progenitors. While it is enriched at the lateral membrane domain in the ventricular endfeet during interphase, mPar3 becomes dispersed and shows asymmetric localization as cell cycle progresses. Either removal or ectopic expression of mPar3 prevents radial glial progenitors from dividing asymmetrically yet generates different outcomes in daughter cell fate specification. Furthermore, the expression level of mPar3 affects Notch signaling, and manipulations of Notch signaling or Numb expression suppress mPar3 regulation of radial glial cell division and daughter cell fate specification. These results reveal a critical molecular pathway underlying asymmetric cell division of radial glial progenitors in the mammalian neocortex.


Figures

Figure 1
Figure 1. Selective localization of mPar3 at ZO-1-expressing lateral membrane region in the ventricular endfeet of radial glial progenitor cells during interphase
(A) Images of E14.5 cortices immunostained with the mPar3 antibody (green) and counterstained with a DNA dye (blue). The arrow indicates the enrichment of mPar3 at the luminal surface of the VZ. A high magnification ventricle en face image of mPar3 is shown to the right (dashed area). Scale bars: 250 μm and 10 μm. (B) Images of E14.5 cortices immunostained with the antibodies against mPar3 (green) and ZO-1 (red). High magnification ventricle en face images (dashed area) are shown in the middle. Cross-section images at the location of the broken line are shown at the bottom. Note that mPar3 largely co-localizes with ZO-1 at the lateral membrane domain in the ventricular endfeet (arrowhead). Scale bars: 250 μm and 5 μm. (C) Images of E14.5 cortices immunostained with the antibodies against mPar3 (green) and β-catenin (red). High magnification ventricle en face images (dashed area) are shown in the middle. Cross-section images at the location of the broken line are shown at the bottom. Note that mPar3 is mostly apical to β-catenin (arrowheads). Scale bars: 250 μm and 10 μm. (D) A diagram that illustrates the subcellular localization of mPar3, ZO-1, N-cadherin and β-catenin in the ventricular endfeet of radial glial cells during interphase.
Figure 2
Figure 2. Asymmetric distribution of mPar3 in dividing radial glial cells in anaphase/telophase
(A) Images of E14.5 cortices immunostained with the antibody against phospho-Vimentin (Ph-Vim, red). High magnification image of the outlined region is shown to the right. Note that the Ph-Vim antibody selectively labels dividing cells in the developing neocortex and reveals their morphology. Scale bars: 250 μm and 10 μm. (B) High magnification ventricle en face images of mPar3 (green) and Ph-Vim (red) at the luminal surface of the VZ. Note a correlation between diffuse mPar3 immunofluorescence and Ph-Vim staining (arrows). Scale bar: 5 μm. (C) Subcellular localization of mPar3 (green) in metaphase radial glial cells labeled by Ph-Vim (red) with condensed DNA staining (blue). Arrowheads indicate mPar3 expression in interphase radial glial cells at the luminal surface of the VZ. Scale bar: 5 μm. (D) Subcellular localization of mPar3 (green) in anaphase/telophase radial glial cells labeled by Ph-Vim (red) with condensed, separated chromosomes (blue). Arrows indicate the cleavage plane and arrowheads indicate mPar3 expression in nearby interphase radial glial cells. Broken lines indicate the contour of dividing radial glial cells. Note that mPar3 is either symmetrically or asymmetrically distributed with respect to the cleavage plane. Scale bar: 5 μm. (E) Quantification of the normalized ratio of mPar3 immunofluorescence and DNA labeling in anaphase/telophase radial glial cells with respect to the cleavage plane. Black circles represent individual cells and red lines represent the average and s.e.m. The broken line indicates the threshold of mPar3 asymmetry. ****, p<5e-6. (F) Quantification of the number of radial glial cells in anaphase/telophase that display mPar3 asymmetry with respect to the orientation of the cleavage plane.
Figure 3
Figure 3. mPar3 regulates asymmetric cell division of radial glial cells in clonal culture
(A) Schematic representation of the procedure for assessing the mode of radial glial cell division using the clonal pair-cell assay. (B) Knockdown of mPar3 impairs asymmetric cell division. (left) Representative images of three different types of daughter-cell pairs originating from individual EGFP-expressing radial glial cells: two radial glial progenitor cells (P-P), one radial glial progenitor cell and one post-mitotic neuron (P-N), and two post-mitotic neurons (N-N). Sibling EGFP-expressing cell pairs derived from individual EGFP-expressing radial glial cells were immunostained with the antibodies against EGFP (green), Pax6 (red), a radial glial marker, and TUJ1 (light blue), a neuronal marker, and counterstained with a DNA dye (blue). Scale bar: 10 μm. (right) Quantification of the percentage of P-P, P-N, and N-N daughter cell pairs derived from control shRNA or mPar3 shRNA-expressing radial glial cells (Control shRNA, 418 cells from five experiments; mPar3 shRNA, 238 cells from four experiments). *, p<0.05. (C) Ectopic expression of mPar3 impairs asymmetric cell division. (left) Representative images of a daughter-cell pair originating from radial glial cells expressing EGFP-mPar3 immunostained with the antibodies against EGFP (green), Pax6 (red), TUJ1 (light blue) and counterstained with a DNA dye (blue). Scale bar: 10 μm. (right) Quantification of the percentage of P-P, P-N, and N-N daughter cell pairs derived from EGFP or EGFP-mPar3 expressing radial glial cells (Control, 275 cells from three experiments; EGFP-mPar3, 200 cells from three experiments). *, p<0.05; **, p<0.005; ***, p<5e-4.
Figure 4
Figure 4. mPar3 regulates asymmetric cell division of radial glial cells in situ
(A) Schematic representation of the procedure for examining the mode of division of radial glial cells in neocortical slices in situ. (B, C) Time-lapse images of radial glial cells expressing EGFP/Control shRNA (B) or EGFP/mPar3 shRNA (C) in organotypic cortical slice cultures. Arrows and arrowheads indicate dividing radial glial cells and their daughter cell pairs. Broken lines indicate the VZ surface. Immunohistochemistry analysis of EGFP-expressing (green) daughter cell pairs using the Tbr2 antibody (red) are shown at the bottom. Scale bars: 50 μm. (D) Quantification of the percentage of EGFP-expressing cells that divide asymmetrically to give rise to a Tbr2+ and a Tbr2- daughter cell (Control shRNA, 9 cells from three animals; mPar3 shRNA, 17 cells from eight animals). *, p<0.05.
Figure 5
Figure 5. mPar3 regulates endogenous Notch signaling activity in the developing neocortex
(A, B) Ectopic expression of mPar3 enhances endogenous Notch signaling activity. (A) Images of cortices expressing CBFRE-EGFP (green) together with control (left) or mPar3 (right) counterstained with a DNA dye (blue). Note that ectopic expression of mPar3 leads to an increase in EGFP expression, primarily in the VZ. Scale bar: 50 μm. (B) Quantification of the percentage of EGFPhigh cells in the developing neocortex (E13-14: Control, 236 cells from five animals; mPar3, 289 cells from five animals; E13-15: Control, 770 cells from five animals; mPar3, 555 cells from five animals). *, p<0.05; **, p<0.005. (C, D) Suppression of mPar3 expression decreases endogenous Notch signaling activity. (C) Images of cortices expressing CBFRE-EGFP (green) together with either Control shRNA (left) or mPar3 shRNA (right) counterstained with a DNA dye (blue). Note that suppression of mPar3 expression causes a decrease in EGFP expression. Scale bar: 50 μm. (D) Quantification of the percentage of EGFPhigh cells in the developing neocortex (E13-14: Control shRNA, 565 cells from five animals; mPar3 shRNA, 204 cells from four animals; E13-15: Control shRNA, 2,030 cells from seven animals; mPar3 shRNA, 2,123 cells from seven animals). n.s., not significant; *, p<0.05.
Figure 6
Figure 6. Mammalian Par3 regulates radial glial daughter cell fate specification
(A, B) Ectopic expression of mPar3 restricts cells to the VZ and promotes a radial glial cell fate. (A) Images of E18 cortices electroporated at E13 with EGFP (top) or EGFP-mPar3 (bottom) immunostained with the antibodies against EGFP (green) and Pax6 (red), a radial glial cell marker, and counterstained with a DNA dye (blue). High magnification images are shown to the right. Filled arrowheads indicate cells that are Pax6+ and open arrowheads indicates cells that are Pax6-. Note that the vast majority of cells expressing EGFP-mPar3 are in the VZ and Pax6+, while cell expressing EGFP are mostly in the CP and Pax6-. Scale bars: 250 μm, 50 μm and 10 μm. (B) Quantification of the percentage of transfected cells that are Pax6+ (Control, 654 cells from three animals; EGFP-mPar3, 143 cells from three animals). ***, p<0.0005. (C, D) Suppression of mPar3 expression causes cells to exit the VZ and leads to an increase in neuronal production. (C) Images of E16 cortices electroporated with EGFP/Control (top) and EGFP/mPar3 shRNA (bottom) at E13 immunostained with the antibodies against EGFP (green) and TUJ1 (red), a neuronal marker, and counterstained with a DNA dye (blue). High magnification images of transfected cells in different locations indicated by arrows and numbers are shown to the right. Note that cells expressing mPar3 shRNA exit the VZ and accumulate in the IZ, and are TUJ1+, while a substantial group of cells expressing control shRNA remain in the VZ and are TUJ1-. Scale bar: 50 μm and 5 μm. (D) Quantification of the percentage of transfected cells that are TUJ1+ (Control, 1,784 cells from six animals; mPar3 shRNA, 1,401 from five animals). **, p<0.001.
Figure 7
Figure 7. Notch signaling activity is required for mPar3 function
(A, B) DN-MAML suppresses the effect of mPar3 ectopic expression on neurogenesis. (A) Images of cortices expressing EGFP/Control, EGFP/mPar3, DN-MAML-EGFP, and mPar3/DN-MAML-EGFP (green) counterstained with a DNA dye (blue). Note that ectopic expression of mPar3 restricts cells to the VZ and this is suppressed by co-expression of DN-MAML. Scale bar: 200 μm. (B) Quantification of the distribution of EGFP-expressing cells in the developing neocortex (E13-15: Control, 945 cells from three animals; mPar3, 279 cells from four animals; DN-MAML-EGFP, 638 cells from three animals; mPar3/DN-MAML-EGFP, 370 cells from four animals). *, p<0.05; **, p<0.005; ***, p<5e-4; n.s., not significant. (C, D) NICD suppresses the effect of mPar3 depletion on neurogenesis. (C) Images of cortices expressing EGFP/Control shRNA, EGFP/mPar3 shRNA, EGFP/Control shRNA/NICD, and EGFP/mPar3 shRNA/NICD (green) counterstained with a DNA dye (blue). Note that suppression of mPar3 expression causes cells to exit the VZ and this is suppressed by co-expression of NICD. Scale bar: 200 μm. (D) Quantification of the distribution of EGFP-expressing cells in the developing neocortex (E13-16: Control, 1,504 cells from four animals; mPar3 shRNA, 863 cells from five animals; NICD, 500 cells from three animals; mPar3 shRNA/NICD, 239 cells from four animals). *, p<0.05; **, p<0.005; ***, p<5e-4; n.s., not significant.
Figure 8
Figure 8. Nb and Nbl are required for mPar3 function
(A, B) Depletion of Nb and Nbl suppresses mPar3 regulation of Notch signaling. (A) Images of cortices expressing CBFRE-GFP (green) together with either Control shRNA or mPar3 shRNA in the absence (left) or presence (right) of Nb/Nbl shRNAs counterstained with a DNA dye (blue). Note that expression of mPar3 shRNA leads to a reduction in EGFP expression and this is suppressed by Nb/Nbl shRNAs. Scale bar: 50 μm. (B) Quantification of the percentage of EGFPhigh cells in the developing neocortex (Control, 2,185 cells from five animals; mPar3 shRNA, 1,014 cells from five animals; Nb/Nbl shRNAs, 1,204 cells from five animals; mPar3 shRNA & Nb/Nbl shRNAs, 1,680 cells from six animals). *, p<0.05; **, p<0.005. (C, D) Depletion of Nb and Nbl suppresses mPar3 regulation of neocortical neurogenesis. (C) Images of cortices expressing EGFP/Control or EGFP/mPar3 shRNA (green) in the absence (left) or presence (right) of Nb/Nbl shRNAs counterstained with a DNA dye (blue). Note that expression of mPar3 shRNA leads to a depletion of cells from the VZ and this is suppressed by Nb/Nbl shRNAs. Scale bar: 100 μm. (D) Quantification of the percentage of EGFP-expressing cells in different regions of the developing neocortex (Control, 1,948 cells from five animals; mPar3 shRNA, 1,153 cells from five animals; Nb/Nbl shRNAs, 3,434 cells from five animals; mPar3 shRNA & Nb/Nbl shRNAs, 3,032 cells from five animals). *, p<0.05; **, p<0.005; ***, p<5e-4; n.s., not significant. (E, F) Overexpression of the Nb-binding region of mPar3 results in a premature depletion of cells from the VZ. (E) Images of cortices expressing EGFP/Control (left) or EGFP/mPar3(937-1036) (right) counterstained with a DNA dye (blue). Scale bar: 50 μm. (F) Quantification of the percentage of EGFP-expressing cells in different regions of the developing neocortex (Control, 1,432 cells from six animals; mPar3(937-1038), 1,071 cells from six animals). **, p<0.005; ***, p<5e-4.
Figure 9
Figure 9. A model that illustrates mPar3 regulation of Notch signaling and asymmetric cell division of radial glial cells in the developing neocortex
Dynamic distribution of mPar3 in radial glial cells leads to differential inheritance of mPar3 by the two daughter cells as the cell cycle progresses. The daughter cell that inherits a greater amount of mPar3 develops high Notch signaling activity and remains a radial glial cell, whereas the daughter cell that inherits less mPar3 harbors low Notch signaling activity and adopts an IPC or a neuronal fate.

Similar articles

Cited by

References

    1. Aaku-Saraste E, Hellwig A, Huttner WB. Loss of occludin and functional tight junctions, but not ZO-1, during neural tube closure--remodeling of the neuroepithelium prior to neurogenesis. Dev Biol. 1996;180:664–679. - PubMed
    1. Adams RJ. Metaphase spindles rotate in the neuroepithelium of rat cerebral cortex. J Neurosci. 1996;16:7610–7618. - PMC - PubMed
    1. Anthony TE, Klein C, Fishell G, Heintz N. Radial glia serve as neuronal progenitors in all regions of the central nervous system. Neuron. 2004;41:881–890. - PubMed
    1. Astrom KE, Webster HD. The early development of the neopallial wall and area choroidea in fetal rats. A light and electron microscopic study. Adv Anat Embryol Cell Biol. 1991;123:1–76. - PubMed
    1. Buchman JJ, Tsai LH. Spindle regulation in neural precursors of flies and mammals. Nat Rev Neurosci. 2007;8:89–100. - PubMed

Publication types

MeSH terms