. 2009 Jul 30;63(2):244-53.
doi: 10.1016/j.neuron.2009.06.019.

Learning substrates in the primate prefrontal cortex and striatum: sustained activity related to successful actions

Affiliations

Learning substrates in the primate prefrontal cortex and striatum: sustained activity related to successful actions

Mark H Histed et al. Neuron. .

Abstract

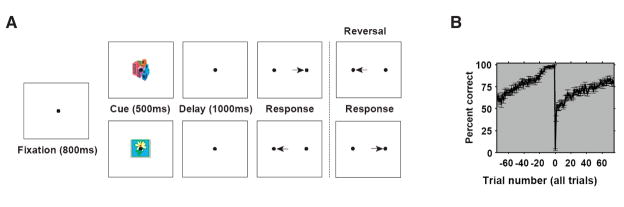
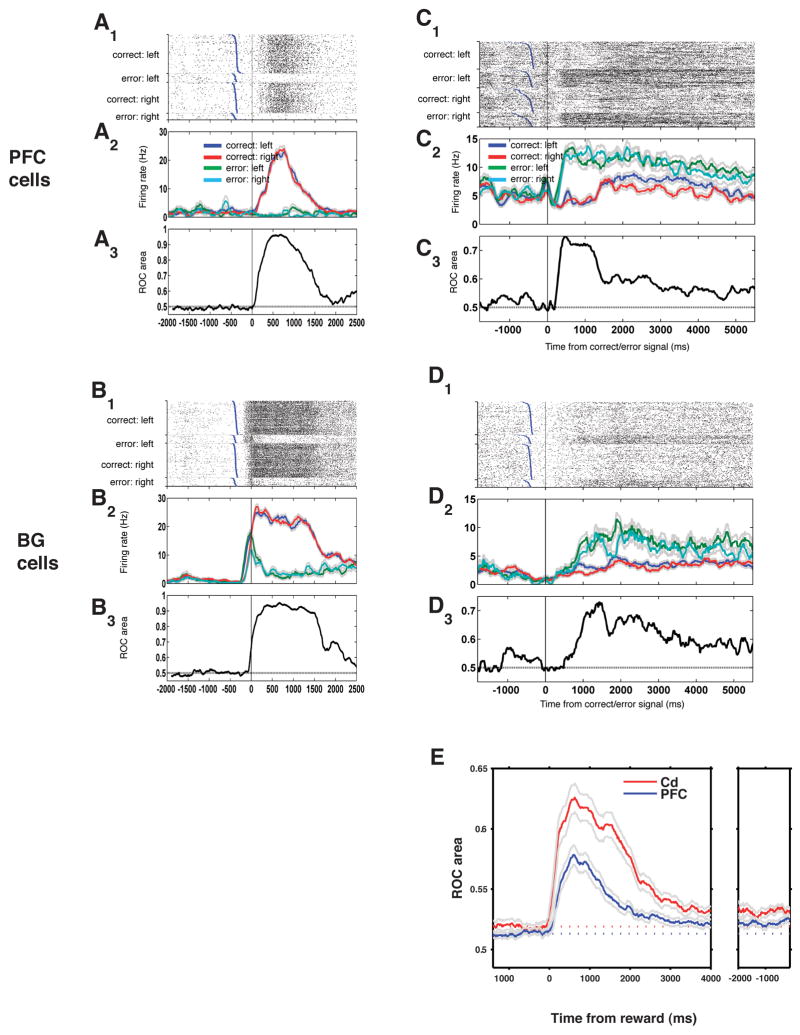
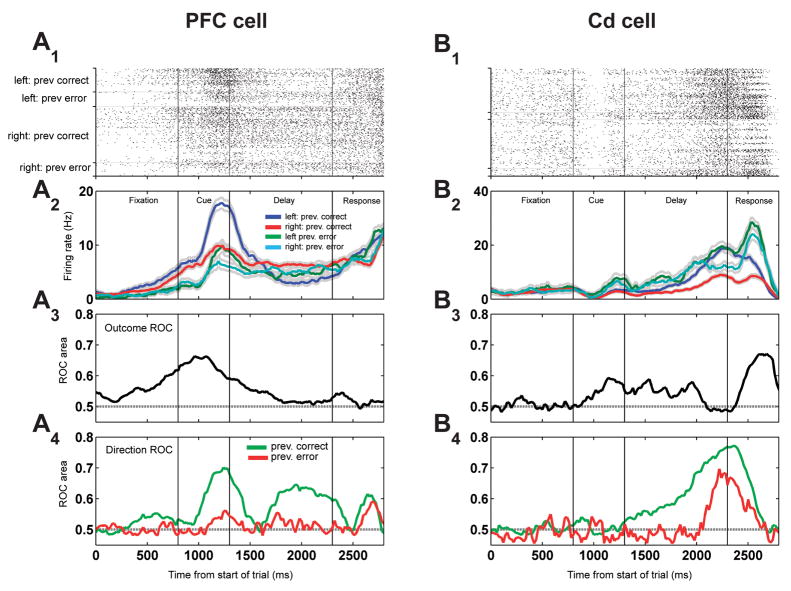
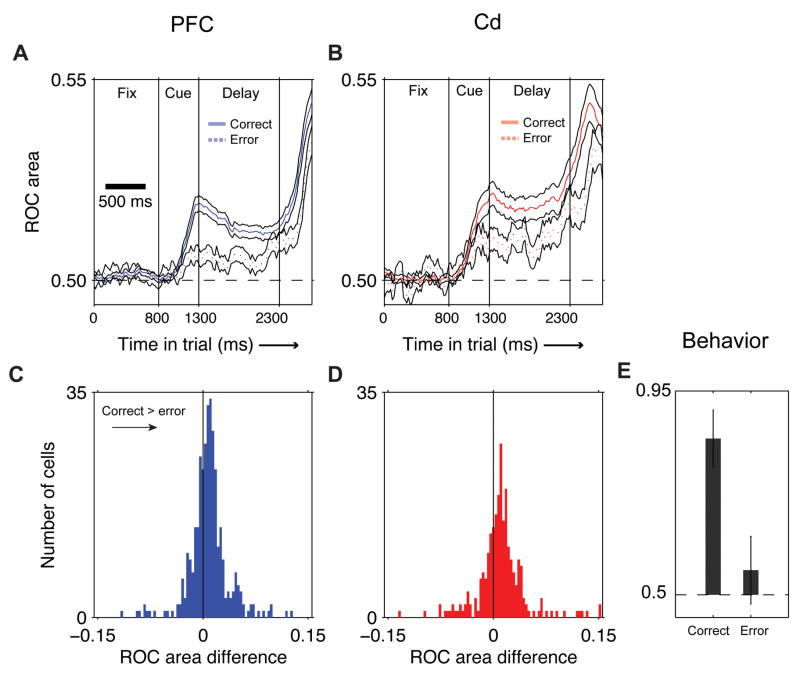
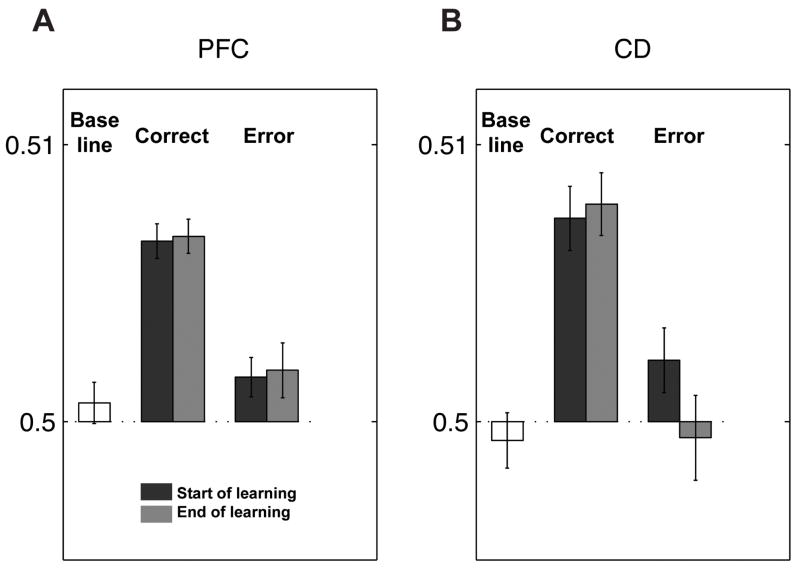
Learning from experience requires knowing whether a past action resulted in a desired outcome. The prefrontal cortex and basal ganglia are thought to play key roles in such learning of arbitrary stimulus-response associations. Previous studies have found neural activity in these areas, similar to dopaminergic neurons' signals, that transiently reflect whether a response is correct or incorrect. However, it is unclear how this transient activity, which fades in under a second, influences actions that occur much later. Here, we report that single neurons in both areas show sustained, persistent outcome-related responses. Moreover, single behavioral outcomes influence future neural activity and behavior: behavioral responses are more often correct and single neurons more accurately discriminate between the possible responses when the previous response was correct. These long-lasting signals about trial outcome provide a way to link one action to the next and may allow reward signals to be combined over time to implement successful learning.


Figures

Figure 1
Figure 1. Behavioral task
A, schematic of the associative learning task. Animals were required to learn, by trial-and-error, an arbitrary association between a picture cue and a directional eye movement response. On each trial, they held their eye position on a central fixation point for 800 ms, and then the cue was turned on for 500 ms. After a 1000 ms memory delay period, the fixation point was extinguished and the animals made their response; the correctness of the response was signaled immediately after the saccade (see Methods). After animals had learned this association, we reversed the pairing with no explicit signal and animals relearned the reversed association. B, Average learning curve, showing performance before and after reversal. X-axis: trial number; at trial 0, the association was reversed with no signal, almost always causing an error (trial 1). Within a few trials, performance reverted to near 50% and then gradually increased as animals learned the new pairing. Error bars: S.E.M.
Figure 2
Figure 2. Cells signal correct or error outcome
A1–3: Single cell recorded from the PFC showing an increase in firing rate after correct outcome was signaled. All three panels show data from the same set of trials. X-axes: time from correct/error feedback signal. Top panel (A1): trial raster; each tick corresponds to a spike. Each row is a different trial; blue ticks, response times (end of saccadic eye movement); trials are sorted by response time within each of the four trial groups. Middle panel (A2): histogram of the same trials. Firing rates (colored lines) were computed by convolving the spike trains in A1 with a 140 ms square kernel. Gray lines: 1 S.E.M. Bottom panel (A3): information that this cell gives about correct vs. error at each time point, measured as area under ROC curve (Y-axis). B1-B3: a 2nd cell from Cd which exhibits a similarly strong increase in firing rate on correct trials. C1-C3 and D1-D3: single PFC and Cd cells showing sustained responses about reward vs. error that lasted for several seconds into the next trial. Conventions as in A and B. E, population summary. Y-axis: mean reward information (reward ROC area) over the population of cells from each area. Blue, PFC mean (N=85; see Methods); red, caudate (N=94). Gray lines: 1 S.E.M. X-axis: time from correct/error feedback signal. Dotted lines indicate baseline information maintained from previous trial (see Discussion); elevation above this level shows additional information gained by neurons because of a single trial’s reward. Left panel: data aligned on reward onset; right panel: aligned on the next trial’s fixation onset (note inter-trial period length for errors: 6.5 s; for corrects: 5.5 s). The population of recorded cells from both areas signals whether single trials are correct or incorrect, and this information is maintained until the next trial.
Figure 3
Figure 3. Direction signal is stronger when previous trial is correct: single cells
Left panels (A1-A4): single PFC cell showing increased direction selectivity after previous trial was correct versus when the previous trial was an error. A1: trial raster; conventions as in Fig. 2A1. Trials are arranged by the response direction the animal chose on a given trial and the correct/error status of the previous trial. A2: Histogram of firing rates, conventions as in Fig. 2A2. A3: Information carried by this cell (measured by ROC area) about the correct vs. error outcome of the previous trial, averaged over response direction of the current trial. A4: Information (ROC area) about the response direction of the current trial, plotted in green when the previous trial was correct and red when the previous trial was an error. Right panels (B1-B4): a single cell recorded from the caudate nucleus; conventions as in A1-A4. Both cells give more information about the animal’s intended response (i.e. ROC area is larger) when the previous trial was correct.
Figure 4
Figure 4. Direction signal is stronger when previous trial is correct: population summary
A, Averaged direction ROC values for all PFC cells when the previous trial was correct (solid blue line) vs. previous error (dotted blue line). Black lines: 1 S.E.M. X-axis, time in trial, Y-axis: average ROC value. B, Averaged direction ROC values for all Cd cells; conventions as in A. For both areas, information about direction is stronger after a correct trial than after an error trial. C-D, Distribution, over all cells, of the difference in ROC value after correct and after error. For each cell, we subtracted the delay period direction ROC value after correct trials from that after error trials. C, blue: PFC cells; D, red: Cd. The distributions are significantly shifted to the right (PFC: p<10−7, Cd: p<10−8, Wilcoxon test), showing stronger direction tuning after correct trials. E, Behavioral performance on the next trial after a correct or error trial. Error bars: std. dev. over 63 experimental sessions. Performance was much higher when the previous trial was correct than when the previous trial was an error.
Figure 5
Figure 5. Increases in direction selectivity after correct trials occur both at the start and end of learning
Y-axis, the delay period direction selectivity (area under ROC curve) of all cells in the population after correct trials, middle bars, and after error trials, right bars. Each repetition of learning, from one reversal to the next, was divided into two sets of trials; the first half are shown as dark gray bars (“start of learning”), and light gray bars show the second half (“end of learning”). The ROC area from the fixation (baseline) period is shown at left. A, PFC neurons; B, Cd. These data show that the increases in direction selectivity after a correct trial exist both early and late in learning.

Comment in

References

    1. Alexander GE, Crutcher MD, DeLong MR. Basal ganglia-thalamocortical circuits: parallel substrates for motor, oculomotor, “prefrontal” and “limbic” functions. Prog Brain Res. 1990;85:119–146. - PubMed
    1. Alexander GE, DeLong MR, Strick PL. Parallel organization of functionally segregated circuits linking basal ganglia and cortex. Annu Rev Neurosci. 1986;9:357–381. - PubMed
    1. Anden NE, Hfuxe K, Hamberger B, Hokfelt T. A quantitative study on the nigro-neostriatal dopamine neuron system in the rat. Acta Physiol Scand. 1966;67:306–312. - PubMed
    1. Apicella P, Ljungberg T, Scarnati E, Schultz W. Responses to reward in monkey dorsal and ventral striatum. Exp Brain Res. 1991;85:491–500. - PubMed
    1. Asaad WF, Rainer G, Miller EK. Neural activity in the primate prefrontal cortex during associative learning. Neuron. 1998;21:1399–1407. - PubMed

Publication types