. 2009 Oct;37(5):149-61.
doi: 10.1016/j.bioorg.2009.06.001. Epub 2009 Jun 13.

Mechanisms of catalysis and inhibition operative in the arginine deiminase from the human pathogen Giardia lamblia

Affiliations

Mechanisms of catalysis and inhibition operative in the arginine deiminase from the human pathogen Giardia lamblia

Zhimin Li et al. Bioorg Chem. 2009 Oct.

Abstract

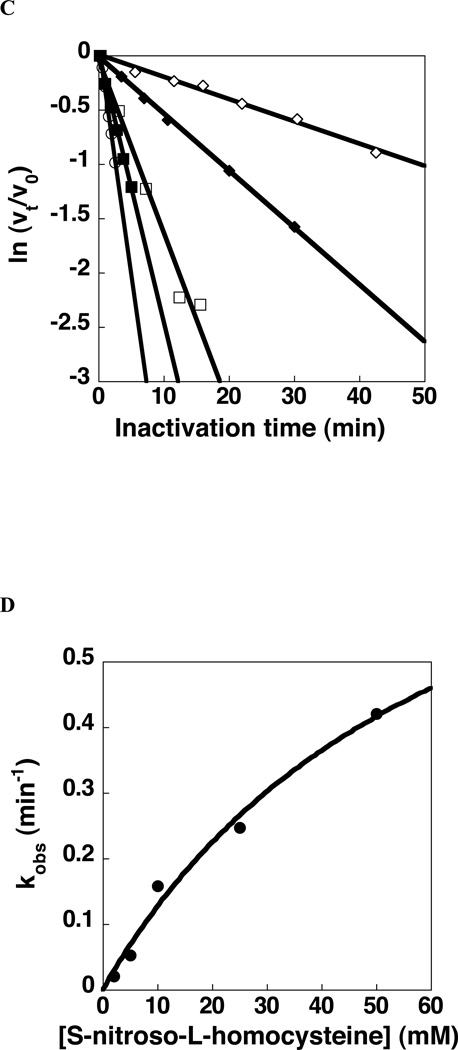
Giardia lamblia arginine deiminase (GlAD), the topic of this paper, belongs to the hydrolase branch of the guanidine-modifying enzyme superfamily, whose members employ Cys-mediated nucleophilic catalysis to promote deimination of l-arginine and its naturally occurring derivatives. G. lamblia is the causative agent in the human disease giardiasis. The results of RNAi/antisense RNA gene-silencing studies reported herein indicate that GlAD is essential for G. lamblia trophozoite survival and thus, a potential target for the development of therapeutic agents for the treatment of giardiasis. The homodimeric recombinant protein was prepared in Escherichia coli for in-depth biochemical characterization. The 2-domain GlAD monomer consists of a N-terminal domain that shares an active site structure (depicted by an insilico model) and kinetic properties (determined by steady-state and transient state kinetic analysis) with its bacterial AD counterparts, and a C-terminal domain of unknown fold and function. GlAD was found to be active over a wide pH range and to accept l-arginine, l-arginine ethyl ester, N(alpha)-benzoyl-l-arginine, and N(omega)-amino-l-arginine as substrates but not agmatine, l-homoarginine, N(alpha)-benzoyl-l-arginine ethyl ester or a variety of arginine-containing peptides. The intermediacy of a Cys424-alkylthiouronium ion covalent enzyme adduct was demonstrated and the rate constants for formation (k(1)=80s(-1)) and hydrolysis (k(2)=35s(-1)) of the intermediate were determined. The comparatively lower value of the steady-state rate constant (k(cat)=2.6s(-1)), suggests that a step following citrulline formation is rate-limiting. Inhibition of GlAD using Cys directed agents was briefly explored. S-Nitroso-l-homocysteine was shown to be an active site directed, irreversible inhibitor whereas N(omega)-cyano-l-arginine did not inhibit GlAD but instead proved to be an active site directed, irreversible inhibitor of the Bacillus cereus AD.


Figures

Fig. 1
Fig. 1
A. Reactions catalyzed by AD, AgD, DDAH and PAD. B. Common reaction mechanism observed for AD (R= H, R’ = L-CH2CH2CH2CH(COO)(NH3+)), AgD (R= H, R’ = CH2CH2CH2CH2(NH3+)), DDAH (R= CH3, R’ = L-CH2CH2CH2CH(COO)(NH3+)) and PAD (R= H, R’ = L-CH2CH2CH2CH(COOEt)(NHBz)).
Fig. 2
Fig. 2
Backbone fold with catalytic scaffold colored (left) and stereodiagram of substrate-binding and catalytic residues, each color coded to coordinate with the color of its locus on the catalytic scaffold (right) for (A) C406A PaAD complexed with L-Arg (PDB ID 2A9G) with a Cys side chain modeled in place of the Ala406 side chain, (B) C249S PaDDAH bound with L- Nω, Nω-dimethylarginine (PDB ID 1H70), (C) AgDI with the carbon atom of the guanindium group of agmatine bonded to the carbon atom of Cys357 (PDB ID 2JER) and (D) PAD H4 bound with Histone 3 N-terminal tail including Arg (PDB ID 2DEW). Ligands are shown in stick representation with carbon atoms colored black, oxygen atoms red and nitrogen atoms blue.
Fig. 3
Fig. 3
A PaAD (PDB ID 2A9G) backbone modeled with the Histone 3 N-terminal tail ligand (shown in stick representation with carbon atoms colored green, nitrogen blue and oxygen red) from the PAD H4 structure (PDB ID 2DEW). The PaAD loop (residue 27–41) that clashes with the ligand is colored red. B. The C406A PaAD tetramer (PDB ID 2A9G) in which the magenta and blue colored subunits represent one dimer unit and the green and yellow colored subunits represent the other dimer unit. The Arg ligand is shown in stick representation with carbon atoms colored black, nitrogen atoms blue and oxygen atoms red.
Fig. 4
Fig. 4
A. SDS-PAGE gel of purified recombinant GlAD shown in the right lane and protein molecular weight standards shown in the left lane. B. The kcat (○) and kcat/Km (●) pH profiles for GlAD catalyzed L-Arg deimination. The kcat/Km profile data were fitted with Eq. (2). The acid range data defined an apparent pKa = 4.3.
Fig. 5
Fig. 5
A. Superposition of the GlAD model (green) and the structure of the C406A PaAD(L-Arg) complex (PDB ID 2A9G) (red). The L-arginine ligand shown in black stick representation. B. Stereodiagram of the active site residues of the modeled GlAD(L-Arg) with carbon atoms colored grey, oxygen atoms red and nitrogen atoms blue.
Fig. 6
Fig. 6
Time courses for the single turnover reaction of 10 µM [14C-1]-L-Arg catalyzed by 150 µM GlAD (wild-type or C397S mutant) in 50 mM K+HEPES (pH 7.5, 25 °C) or 150 µM EcAD (wild-type or C424A) in 50 mM Bis-Tris (pH 6.0)/20 MgCl2. A. GlAD time courses: [14C-1]-L-arginine (●) and [14C-1]-L-citrulline (○). B. GlAD time courses: [14C]-labeled wild-type GlAD (●) and (○)[14C]-labeled C424A AD. C. EcAD time courses: [14C-1]-L-arginine (●) and [14C-1]-L-citrulline (○). D. EcAD time courses: [14C]-wild-type EcAD (●) and (○)[14C]-labeled C397S EcAD.
Fig. 7
Fig. 7
Schemes depicting the reaction of the GlAD Cys424 with (A) a L-Arg analog carrying an electrophilic “warhead”, (B) a L-Arg analog modified with a group “Y” that blocks the hydrolysis partial reaction, (C) S-nitroso-L-homoseine, (D) Nω-cyano-L-Arg and (E) Nω-amino-L-Arg.
Fig. 7
Fig. 7
Schemes depicting the reaction of the GlAD Cys424 with (A) a L-Arg analog carrying an electrophilic “warhead”, (B) a L-Arg analog modified with a group “Y” that blocks the hydrolysis partial reaction, (C) S-nitroso-L-homoseine, (D) Nω-cyano-L-Arg and (E) Nω-amino-L-Arg.
Fig. 8
Fig. 8
Time- and concentration-dependent inactivation of S-nitroso-L-homocysteine to GlAD (10 μM) at pH 7.5, 50 mM HEPES and 25°C. (A) Plot of ln(vt/v0) vs. time. 2 mM (◇), 5 mM (◆), 10 mM (□), 30 mM(■), 60 mM (○), and 90 mM (●) of S-nitroso-L-homocysteine. (B) Plot of kobs vs. S-nitroso-L-homocysteine concentration with data fitted to the Eq. (9) to obtain KI and kinact values. Time and concentration dependence of the inactivation of BcAD (12 μM) by S-nitroso-L-homocysteine in 50 mM K+HEPES at pH 7.0 and 25 °C. (C) Plot of ln(vt/vo) vs time. 2 mM (◇), 5 mM (◆), 10 mM (□), 25 mM (■) and 50 mM (○) S-nitroso-L-homocysteine. (D) Plot of kobs vs S-nitroso- L-homocysteine concentration with data fitting to Eq. (9). Time and concentration dependence of the inactivation of BcAD by Nω-cyano-L-Arg in 50 mM K+HEPES at pH 7.0 and 25 °C. (E) Plot of ln(vt/vo) vs time. 0 mM (◇), 5 mM (◆), 10 mM (□), 20 mM (■) and 40 mM (○) Nω-cyano-L-Arg. (F) Plot of kobs vs Nω-cyano-L-Arg concentration with data fitting to Eq. (9).
Fig. 8
Fig. 8
Time- and concentration-dependent inactivation of S-nitroso-L-homocysteine to GlAD (10 μM) at pH 7.5, 50 mM HEPES and 25°C. (A) Plot of ln(vt/v0) vs. time. 2 mM (◇), 5 mM (◆), 10 mM (□), 30 mM(■), 60 mM (○), and 90 mM (●) of S-nitroso-L-homocysteine. (B) Plot of kobs vs. S-nitroso-L-homocysteine concentration with data fitted to the Eq. (9) to obtain KI and kinact values. Time and concentration dependence of the inactivation of BcAD (12 μM) by S-nitroso-L-homocysteine in 50 mM K+HEPES at pH 7.0 and 25 °C. (C) Plot of ln(vt/vo) vs time. 2 mM (◇), 5 mM (◆), 10 mM (□), 25 mM (■) and 50 mM (○) S-nitroso-L-homocysteine. (D) Plot of kobs vs S-nitroso- L-homocysteine concentration with data fitting to Eq. (9). Time and concentration dependence of the inactivation of BcAD by Nω-cyano-L-Arg in 50 mM K+HEPES at pH 7.0 and 25 °C. (E) Plot of ln(vt/vo) vs time. 0 mM (◇), 5 mM (◆), 10 mM (□), 20 mM (■) and 40 mM (○) Nω-cyano-L-Arg. (F) Plot of kobs vs Nω-cyano-L-Arg concentration with data fitting to Eq. (9).

Similar articles

Cited by

References

    1. Zuniga M, Perez G, Gonzalez-Candelas F. Mol. Phylogenet. Evol. 2002;25:429–444. - PubMed
    1. Cunin R, Glansdorff N, Pierard A, Stalon V. Microbiol. Rev. 1986;50:314–352. - PMC - PubMed
    1. Shirai H, Blundell TL, Mizuguchi K. Trends Biochem. Sci. 2001;26:465–468. - PubMed
    1. Nakada Y, Itoh Y. Microbiology. 2003;149(Pt 3):707–714. - PubMed
    1. Llacer JL, Polo LM, Tavarez S, Alarcon B, Hilario R, Rubio V. J. Bacteriol. 2007;189:1254–1265. - PMC - PubMed

Publication types

LinkOut - more resources