. 2009 Oct 16;284(42):29180-92.
doi: 10.1074/jbc.M109.018085. Epub 2009 Jul 29.

Through the looking glass, mechanistic insights from enantiomeric human defensins

Affiliations

Through the looking glass, mechanistic insights from enantiomeric human defensins

Gang Wei et al. J Biol Chem. .

Abstract

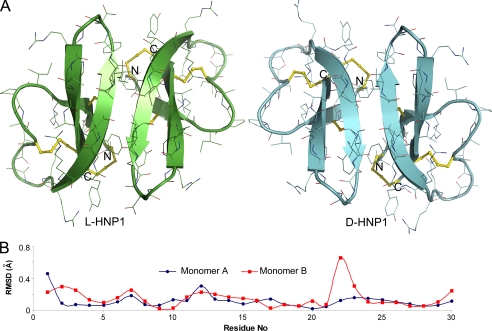
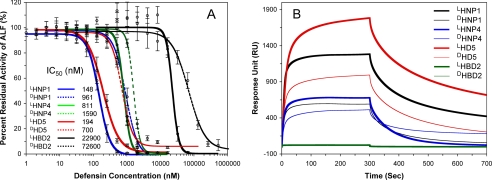
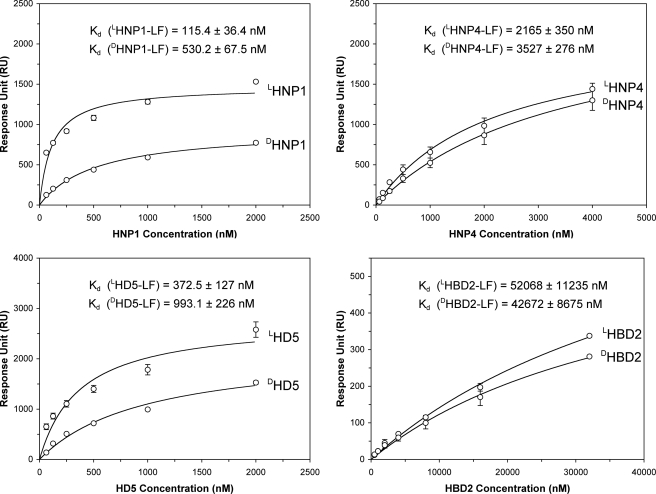
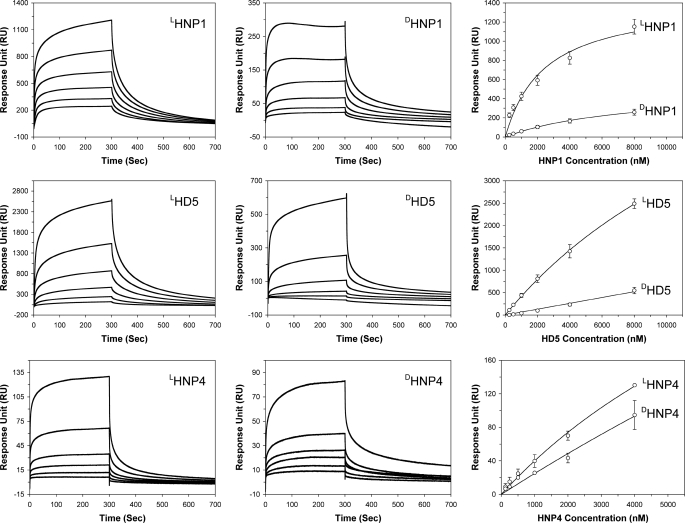
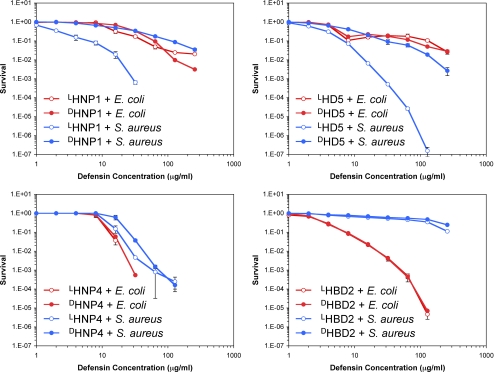
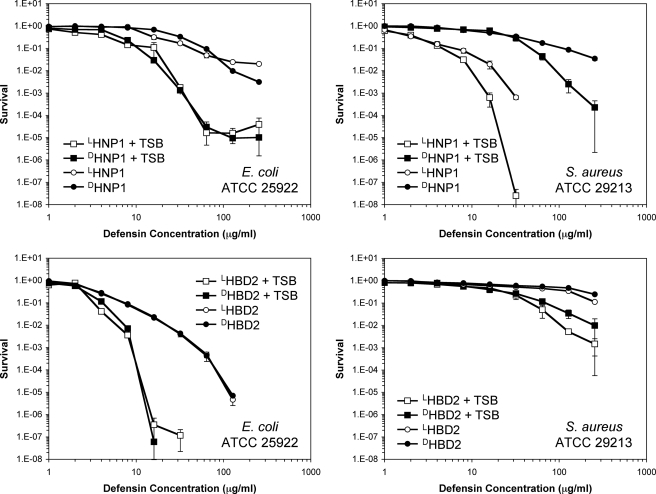
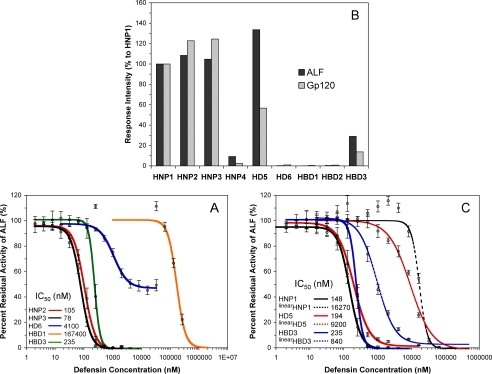
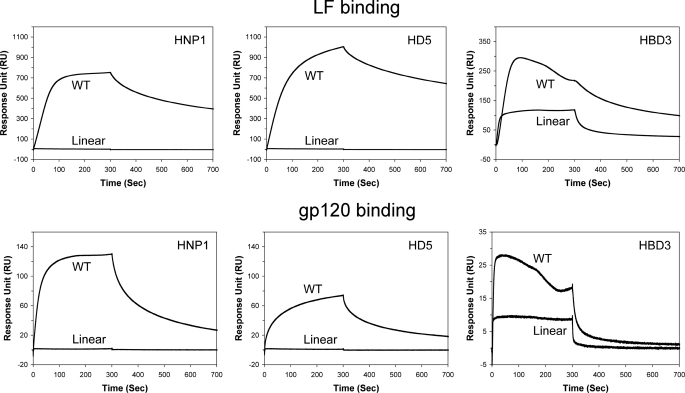
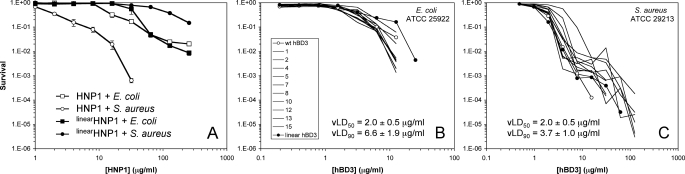
Despite the small size and conserved tertiary structure of defensins, little is known at a molecular level about the basis of their functional versatility. For insight into the mechanism(s) of defensin function, we prepared enantiomeric pairs of four human defensins, HNP1, HNP4, HD5, and HBD2, and studied their killing of bacteria, inhibition of anthrax lethal factor, and binding to HIV-1 gp120. Unstructured HNP1, HD5, and HBD3 and several other human alpha- and beta-defensins were also examined. Crystallographic analysis showed a plane of symmetry that related (L)HNP1 and (D)HNP1 to each other. Either d-enantiomerization or linearization significantly impaired the ability of HNP1 and HD5 to kill Staphylococcus aureus but not Escherichia coli. In contrast, (L)HNP4 and (D)HNP4 were equally bactericidal against both bacteria. d-Enantiomers were generally weaker inhibitors or binders of lethal factor and gp120 than their respective native, all-l forms, although activity differences were modest, particularly for HNP4. A strong correlation existed among these different functions. Our data indicate: (a) that HNP1 and HD5 kill E. coli by a process that is mechanistically distinct from their actions that kill S. aureus and (b) that chiral molecular recognition is not a stringent prerequisite for other functions of these defensins, including their ability to inhibit lethal factor and bind gp120 of HIV-1.


Figures

FIGURE 1.
FIGURE 1.
Crystal structures of LHNP1 and DHNP1 related to one another by a plane of symmetry. A, ribbon diagrams of HNP1 dimers in the asymmetric unit of LHNP1 and DHNP1 crystals. The three conserved disulfide bridges are shown as yellow sticks. B, root mean square deviations of Cα atoms between two enantiomeric monomers of HNP1. Monomers A and B of LHNP1 were compared with monomers A and B of inverted DHNP1, respectively.
FIGURE 2.
FIGURE 2.
Inhibition and binding of LF by enantiomeric defensins. A, inhibition of LF activity by different concentrations of l- (solid line) or d-defensin (dotted line). The data are averages of three independent enzyme kinetic measurements, except for LHNP1, for which 24 independent measurements were performed. A Student t-test was used to calculate the p values for statistical significance: p = 0.0084 for LHNP1/DHNP1; p = 0.066 for LHNP4/DHNP4; p = 0.014 for LHD5/DHD5; and p = 0.17 for LHBD2/DHBD2. B, representative sensorgrams of l (thick lines)- and d (thin lines)-defensins, each at 1 μm, on 2500 RU of immobilized LF.
FIGURE 3.
FIGURE 3.
Enantiomeric defensins bound to 2500 RUs of immobilized LF as a function of concentration. The RU values collected at t = 300 s from three independent SPR measurements were fitted to a one-site binding model (Y = Bmax·X/[Kd + X]) using Graphpad Prism version 4.0. The p values were calculated using a Student's t-Test: p < 0.001 for LHNP1/DHNP1; p = 0.0019 for LHNP4/DHNP4; p < 0.001 for LHD5/DHD5; p = 0.09 for LHBD2/DHBD2.
FIGURE 4.
FIGURE 4.
Binding of enantiomeric defensins to HIV gp120. Left and middle columns: representative sensorgrams of enantiomeric defensins at different concentrations (from 250 nm to 8 μm for HNP1 and HD5, and from 125 nm to 4 μm for HNP4). A sensor chip with 2830 RUs of gp120 was used for HNP1 and HD5 binding, and 3200 RUs of gp120 were immobilized for HNP4 measurements. Right column: RU values at 300 s of association from three independent SPR measurements were fitted to a one-site binding model (Y = Bmax·X/[Kd + X]) using GraphPad Prism version 4.0. The p values for statistical significance are: p = 0.003 for LHNP1/DHNP1, p = 0.022 for LHD5/DHD5, and p = 0.024 for LHNP4/DHNP4.
FIGURE 5.
FIGURE 5.
Survival curves of E. coli ATCC 25922 (red) and S. aureus ATCC 29213 (blue) exposed to l- (empty circles) and d-defensin (filled circles). Strains were exposed to the peptides at concentrations varying 2-fold from 1 to 256 μg/ml. Each curve is the mean of two (HNP1, HD5, and HBD2) or three (HNP4) separate experiments, where the error bars represent the ±S.D. of the measurements. Points scored as zero survival could not be plotted.
FIGURE 6.
FIGURE 6.
Survival curves of E. coli ATCC 25922 and S. aureus ATCC 29213 exposed to l- (empty symbols) and d-defensin (filled symbols) in the presence (squares) and absence (circles) of 1% TSB. Strains were exposed to the peptides at concentrations varying 2-fold from 1 to 256 μg/ml. Each curve is the mean of two separate experiments, where the error bars represent the ±S.D. of the measurements. Points scored as zero survival could not be plotted.
FIGURE 7.
FIGURE 7.
Inhibition and binding of LF by other defensins. A, inhibition of LF activity by different concentrations of HNP2 (red), HNP3 (black), HD6 (blue), HBD1 (orange), and HBD3 (green). B, percent RU, relative to HNP1, at 300 s of association of 100 nm defensin on 2500 RUs of immobilized LF or 2830 RUs of immobilized gp120. C, inhibition of LF activity by linearized defensins (dotted lines): linearHNP1 (black), linearHD5 (red), and linearHBD3 (blue). Each inhibition curve is the mean of three independent enzyme kinetic measurements. The p values for statistical significance are: p = 0.0012 for HNP1/linearHNP1, p = 0.0046 for HD5/linearHD5, and p = 0.0076 for HBD3/linearHBD3.
FIGURE 8.
FIGURE 8.
Comparison of native HNP1, HD5, and HBD3 with their corresponding unstructured forms, each at 100 nm, in LF (top panels) and gp120 (bottom panels) binding. Sensor chips with 2500 RUs of LF and 2830 RUs of gp120 were used for the SPR measurements.
FIGURE 9.
FIGURE 9.
Survival curves of E. coli ATCC 25922 and S. aureus ATCC 29213 exposed to HNP1 and linearHNP1 (A), and, to HBD3, linearHBD3 and 10 disulfide analogs of HBD3 (B and C). Strains were exposed to the peptides at concentrations varying 2-fold from 1 to 256 μg/ml (HNP1 and linearHNP1), 0.195 to 50 μg/ml (HBD3 and E. coli), or 0.488 to 125 μg/ml (HBD3 and S. aureus). Each curve is the mean of two (HNP1 and linearHNP1) or three (HBD3 and analogs) separate experiments. Points scored as zero survival could not be plotted.

References

    1. Zasloff M. (2002) Nature 415, 389–395 - PubMed
    1. Selsted M. E., Ouellette A. J. (2005) Nat. Immunol. 6, 551–557 - PubMed
    1. Lehrer R. I. (2004) Nat. Rev. Microbiol. 2, 727–738 - PubMed
    1. Ganz T. (2003) Nat. Rev. Immunol. 3, 710–720 - PubMed
    1. Bevins C. L. (2006) Biochem. Soc. Trans. 34, 263–266 - PubMed

Publication types

LinkOut - more resources