. 2009 Sep;132(Pt 9):2336-49.
doi: 10.1093/brain/awp194. Epub 2009 Jul 29.

Impairment of bidirectional synaptic plasticity in the striatum of a mouse model of DYT1 dystonia: role of endogenous acetylcholine

Affiliations

Impairment of bidirectional synaptic plasticity in the striatum of a mouse model of DYT1 dystonia: role of endogenous acetylcholine

Giuseppina Martella et al. Brain. 2009 Sep.

Abstract

DYT1 dystonia is a severe form of inherited dystonia, characterized by involuntary twisting movements and abnormal postures. It is linked to a deletion in the dyt1 gene, resulting in a mutated form of the protein torsinA. The penetrance for dystonia is incomplete, but both clinically affected and non-manifesting carriers of the DYT1 mutation exhibit impaired motor learning and evidence of altered motor plasticity. Here, we characterized striatal glutamatergic synaptic plasticity in transgenic mice expressing either the normal human torsinA or its mutant form, in comparison to non-transgenic (NT) control mice. Medium spiny neurons recorded from both NT and normal human torsinA mice exhibited normal long-term depression (LTD), whereas in mutant human torsinA littermates LTD could not be elicited. In addition, although long-term potentiation (LTP) could be induced in all the mice, it was greater in magnitude in mutant human torsinA mice. Low-frequency stimulation (LFS) can revert potentiated synapses to resting levels, a phenomenon termed synaptic depotentiation. LFS induced synaptic depotentiation (SD) both in NT and normal human torsinA mice, but not in mutant human torsinA mice. Since anti-cholinergic drugs are an effective medical therapeutic option for the treatment of human dystonia, we reasoned that an excess in endogenous acetylcholine could underlie the synaptic plasticity impairment. Indeed, both LTD and SD were rescued in mutant human torsinA mice either by lowering endogenous acetylcholine levels or by antagonizing muscarinic M1 receptors. The presence of an enhanced acetylcholine tone was confirmed by the observation that acetylcholinesterase activity was significantly increased in the striatum of mutant human torsinA mice, as compared with both normal human torsinA and NT littermates. Moreover, we found similar alterations of synaptic plasticity in muscarinic M2/M4 receptor knockout mice, in which an increased striatal acetylcholine level has been documented. The loss of LTD and SD on one hand, and the increase in LTP on the other, demonstrate that a 'loss of inhibition' characterizes the impairment of synaptic plasticity in this model of DYT1 dystonia. More importantly, our results indicate that an unbalanced cholinergic transmission plays a pivotal role in these alterations, providing a clue to understand the ability of anticholinergic agents to restore motor deficits in dystonia.


Figures

Figure 1
Figure 1
Mouse genotyping and characterization of medium spiny neurons. (A) Analysis of NT, hWT and hMT mice genotype. Representative gel images of PCR products before (a) and after (b) digestion are shown. Products from hWT and hMT mice appear in lanes 2 and 3. Lane 2 shows two major fragments of 279 and 238 bp; lane 3 shows an identical fragment of 279 bp, and a different fragment of 259 bp. Note, in NT mice, the absence of human torsinA (lane 1). (B) Superimposed traces showing voltage responses to current steps (800 pA, 700 ms) in both depolarizing and hyperpolarizing direction in a MSN recorded from either hWT (black trace; RMP = –81 mV) or hMT (red trace; RMP = −78 mV) mice. The long depolarizing ramp to spike threshold, as well as the strong inward rectification during hyperpolarizing steps are peculiar features of striatal spiny neurons. (C and E) Light micrographs of a corticostriatal coronal and parasagittal slice preparation, respectively. Scale bars: 800 µM. Red dots indicate where the stimulating electrode was positioned. In E, dotted lines indicate the site where a knife cut was made between the striatum and the thalamus, to prevent contamination from thalamostriatal inputs. (D and F) Confocal microscope images of biocytin-loaded medium spiny neurons, recorded from coronal (D) or parasagittal (F) slices from hMT mice. Note the branched dendrites densely embedded with spines. Scale bar: 20 µm. Ctx = cortex; Str = striatum; Rt = reticular nucleus of the thalamus; Hip = hippocampus; ic = internal capsula; aca = anterior commissure, anterior; LV = lateral ventricle; Thl = thalamus.
Figure 2
Figure 2
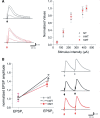
Synaptic properties of the recorded cells. (A) EPSPs evoked by cortical stimulation (arrow indicates the time of synaptic stimulation). The superimposed traces show no differences between hWT and hMT (lower traces) at the three different stimulation intensities (indicated in the graph). The graph shows the normalized input–output relationship measured in the NT (grey circles), hWT (open circles) and hMT (red circles) mice. Circles represent the three different intensities of the stimulation needed to evoke the EPSPs of increasing amplitude in MSNs of the three genotypes. No statistically significant difference was measured among groups. (B) Paired-pulse facilitation (50 ms interstimulus interval) is preserved in both hWT and hMT mice as compared with NT neurons. (Right) Representative paired recordings of EPSPs measured from MSNs from the three distinct groups of mice. Each data point in the plot is the mean ± SEM of at least six independent recordings.
Figure 3
Figure 3
NMDA and AMPA receptor subunit expression. hWT and hMT mice display unaltered levels of the NMDA and AMPA receptor subunits in their striatum. Western blotting analyses performed on striatal protein extracts deriving from hWT, hMT and NT control mice (n = 8 per genotype) reveal comparable amount of each of the (A) NMDA and (B) AMPA receptor subunits. Representative blots comparing the different genotypes are shown for each protein detected. All values are expressed as mean ± SEM. Genotypes are as indicated.
Figure 4
Figure 4
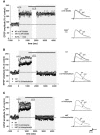
Bidirectional synaptic plasticity changes in hMT mice. (A and B) Time-course of LTD in NT controls, hWT and hMT mice recorded from both coronal (A, inset) and parasagittal slices (B, inset). HFS (arrow) induced LTD both in NT (filled circles) and hWT (open circles) mice, but not in hMT mice (grey circles), in both slice preparations. On the right, sample EPSPs recorded before (pre) and 20 min after (post) HFS in control (top), hWT (middle) and hMT (bottom) mice. (C, D) The LTP induction protocol caused LTP in NT (filled circles), and hWT MSNs (open circles), in MSNs recorded from both coronal (C) and parasagittal slices (D). The magnitude of LTP measured in hMT mice was significantly higher (grey circles). Once established, LTP could be depotentiated to resting levels by an LFS (bars) protocol (2 Hz, 10 min). SD occurred both in control and hWT mice. In MSNs from hMT mice, LFS failed to induce SD (grey circles), in both slice preparations. (Right) Sample traces recorded before and after LFS in the three strains of mice. The red bar indicates at which time point samples were measured. Each data point represents the mean ± SEM of at least 10 and 6 independent observations (from coronal and parasagittal slices, respectively).
Figure 5
Figure 5
Lowering cholinergic tone rescues LTD. (A) In slices pre-treated with a depletor of endogenous acetylcholine, hemicholinium-3 (300 nM, 20 min), HFS restored LTD in hMT mice (grey circles) without modifying LTD in NT and hWT mice (filled and open circles, respectively). (Right) Sample traces show the EPSP recorded before (pre) and after (post, 20 min) HFS in slices from hWT and hMT mice. (B) LTD was fully restored in hMT mice (grey circles) in the presence of the M1-preferring antagonist pirenzepine (100 nM, 20 min). Superimposed traces pre- and post-HFS in pirenzepine. (C) Similarly, either acute pre-incubation of the slice (3 µM, 15 min, open squares), or chronic treatment (3 days, 20 mg/kg i.p., grey squares) with tryhexyphenydil rescued LTD in hMT mice. (Right) Sample traces recorded before and 20 min after HFS in tryhexyphenydil. (D) In slices incubated with the muscarinic autoreceptor antagonist AF-DX384 (300 nM, 20 min), HFS was unable to induce LTD both in NT controls (filled circles) and hWT (open circles) mice. Representative recordings pre- and post-HFS in AF-DX384. Each data point represents the mean ± SEM of at least 10 independent observations.
Figure 6
Figure 6
SD is modulated by cholinergic agents. (A) In NT or hWT mice, the muscarinic autoreceptor antagonist AF-DX384 (300 nM) prevented the LFS-induced SD (filled and open circles, respectively). A similar finding was observed in mice lacking M2/M4 muscarinic autoreceptors (grey square). Representative recordings from hWT treated mice (top) and from M2/M4−/− mice, pre- and post-LFS. (B) After LTP induction, but 15 min before applying low-frequency stimulation, bath-applied 3-hemicholinium (300 nM, black bar) was able to restore SD in hMT mice (grey circles), without affecting it in NT mice. Right. Representative traces recorded pre- and post-LFS in hMT mice. (C) Similarly, both pirenzepine (100 nM) and tryhexyphenydil (3 µM) applied for 15 min before presenting LFS, were able to restore SD in hMT mice. (Right) Sample recordings pre- and post-LFS protocol. Each data point represents the mean ± SEM of at least six independent observations.
Figure 7
Figure 7
Measurement of acetylcholinesterase activity. Comparable levels of acetylcholinesterase activity were measured in the striatum of NT and hWT mice. Conversely, a significant increase in enzymatic activity was detected in the striatum of hMT mice. Values are the mean ± SEM of at least eight independent observations. (*P < 0.05).

Similar articles

Cited by

References

    1. Albin RL, Young AB, Penney JB. The functional anatomy of basal ganglia disorders. Trends Neurosci. 1989;12:366–75. - PubMed
    1. Anderson WW, Collingridge GL. Capabilities of the WinLTP data acquisition program extending beyond basic LTP experimental functions. J Neurosci Methods. 2007;162:346–56. - PubMed
    1. Berardelli A, Rothwell JC, Hallett M, Thompson PD, Manfredi M, Marsden CD. The pathophysiology of primary dystonia. Brain. 1998;121:1195–212. - PubMed
    1. Bonsi P, Martella G, Cuomo D, Platania P, Sciamanna G, Bernardi G, et al. Loss of muscarinic autoreceptor function impairs long-term depression, but not long-term potentiation in the striatum. J Neurosci. 2008;28:6258–63. - PMC - PubMed
    1. Breakefield XO, Blood AJ, Li Y, Hallett M, Hanson PI, Standaert DG. The pathophysiological basis of dystonias. Nat Rev Neurosci. 2008;9:222–34. - PubMed

Publication types