. 2009 Jul 29;29(30):9458-70.
doi: 10.1523/JNEUROSCI.2047-09.2009.

Deviant ryanodine receptor-mediated calcium release resets synaptic homeostasis in presymptomatic 3xTg-AD mice

Affiliations

Deviant ryanodine receptor-mediated calcium release resets synaptic homeostasis in presymptomatic 3xTg-AD mice

Shreaya Chakroborty et al. J Neurosci. .

Abstract

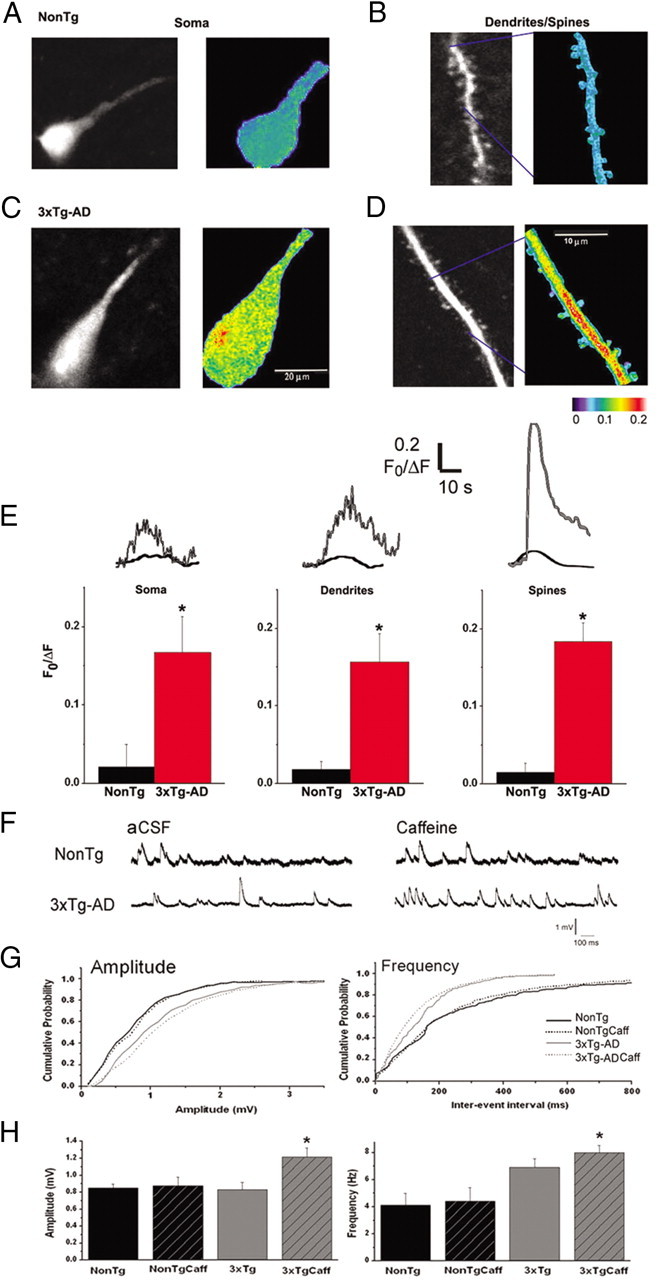
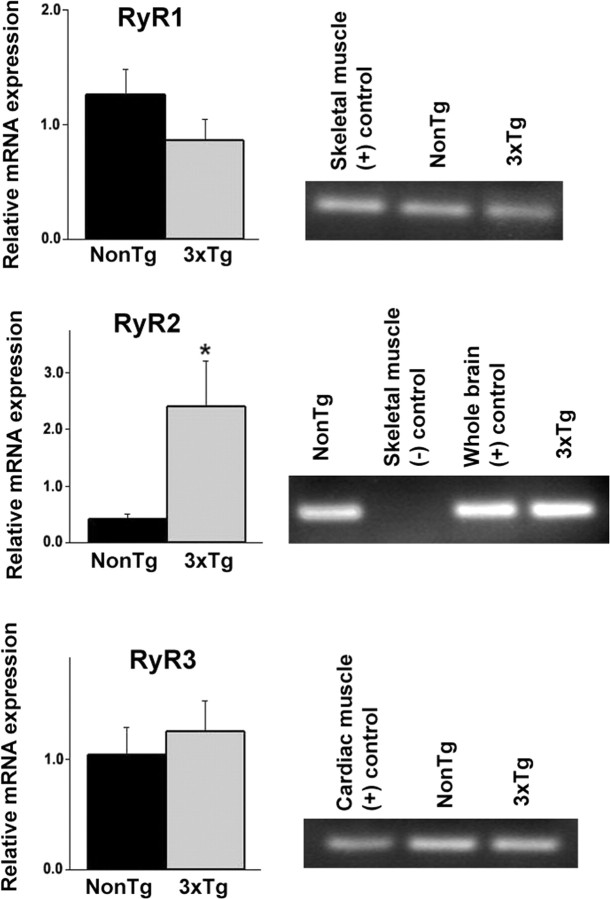
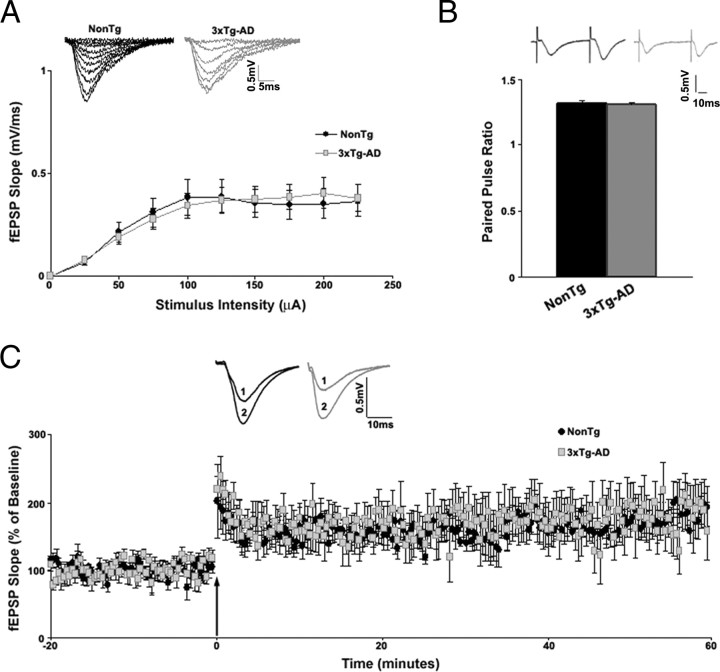
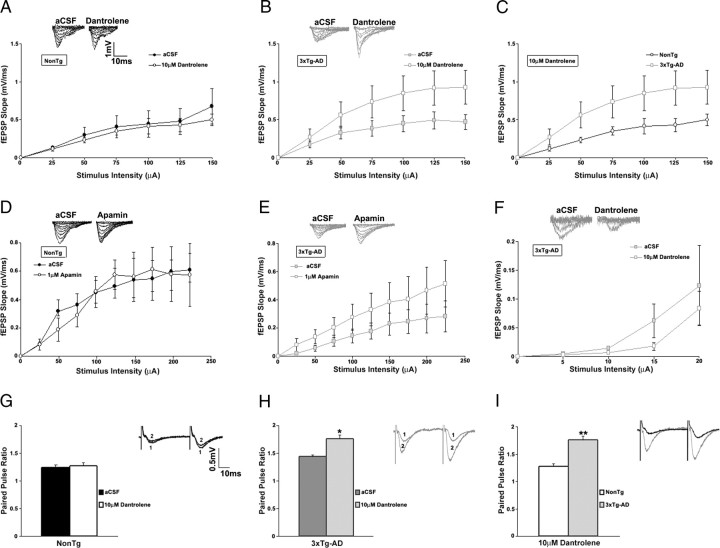
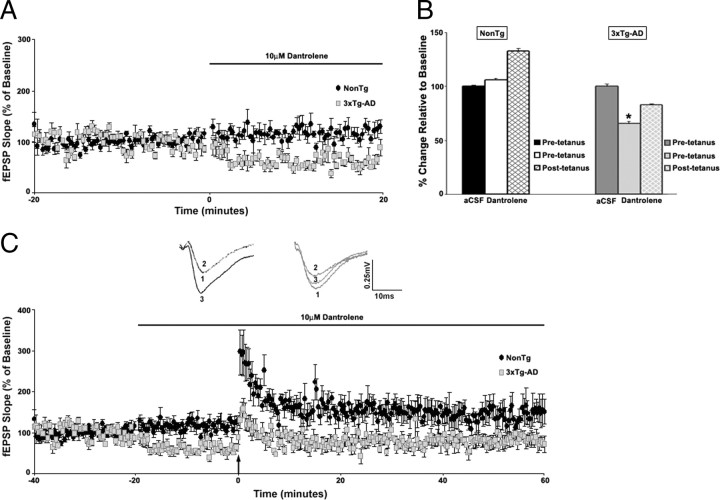
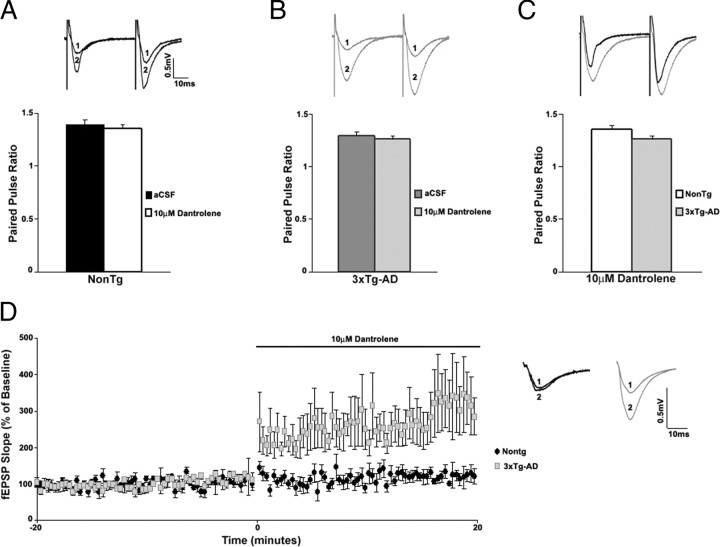
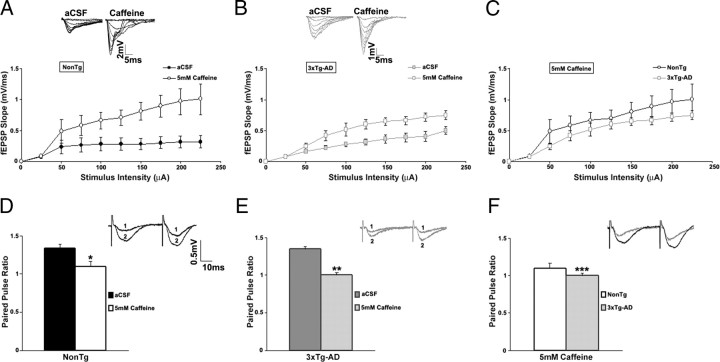
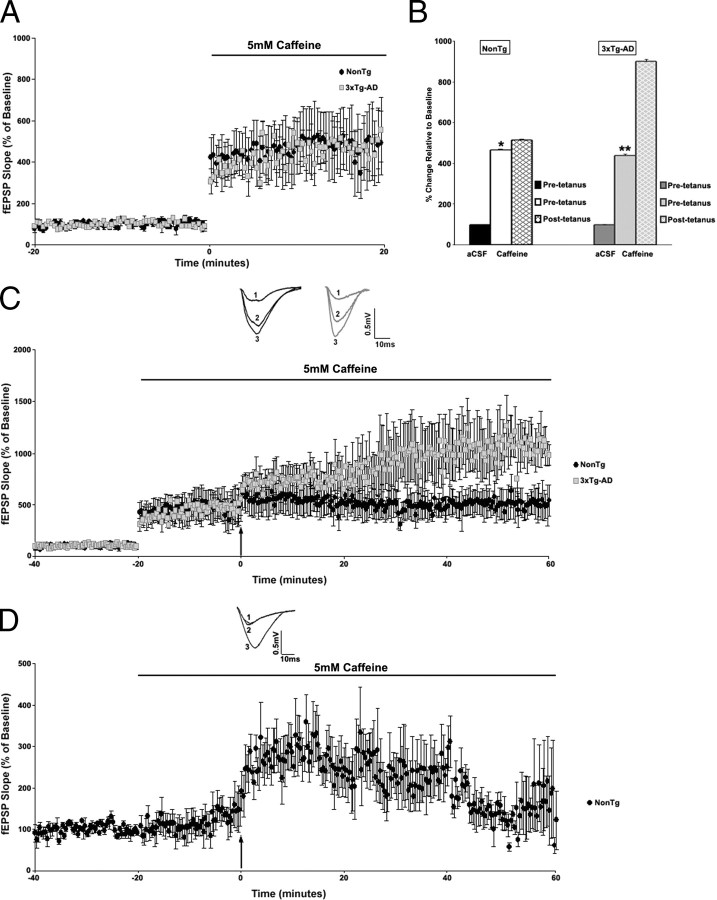
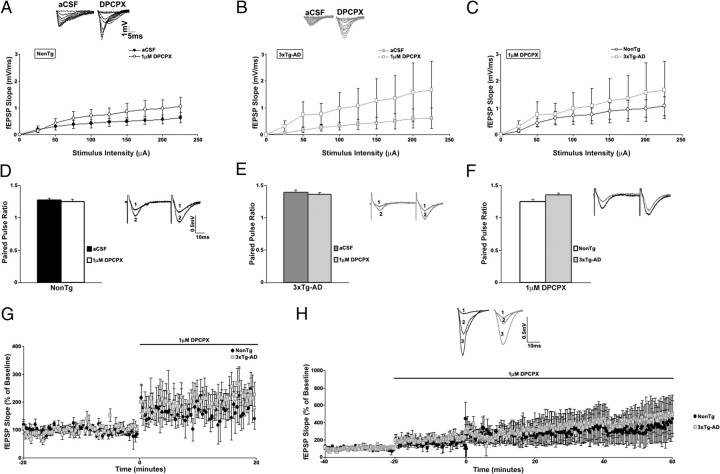
Presenilin mutations result in exaggerated endoplasmic reticulum (ER) calcium release in cellular and animal models of Alzheimer's disease (AD). In this study, we examined whether dysregulated ER calcium release in young 3xTg-AD neurons alters synaptic transmission and plasticity mechanisms before the onset of histopathology and cognitive deficits. Using electrophysiological recordings and two-photon calcium imaging in young (6-8 weeks old) 3xTg-AD and non-transgenic (NonTg) hippocampal slices, we show a marked increase in ryanodine receptor (RyR)-evoked calcium release within synapse-dense regions of CA1 pyramidal neurons. In addition, we uncovered a deviant contribution of presynaptic and postsynaptic ryanodine receptor-sensitive calcium stores to synaptic transmission and plasticity in 3xTg-AD mice that is not present in NonTg mice. As a possible underlying mechanism, the RyR2 isoform was found to be selectively increased more than fivefold in the hippocampus of 3xTg-AD mice relative to the NonTg controls. These novel findings demonstrate that 3xTg-AD CA1 neurons at presymptomatic ages operate under an aberrant, yet seemingly functional, calcium signaling and synaptic transmission system long before AD histopathology onset. These early signaling alterations may underlie the later synaptic breakdown and cognitive deficits characteristic of later stage AD.


Figures

Figure 1.
Figure 1.
Increased RyR-evoked Ca2+ release in CA1 hippocampal neurons from 3xTg-AD mice. A, Left, Baseline two-photon Ca2+ image of a representative CA1 pyramidal neuron from a NonTg mouse. Right, Pseudocolored image of Ca2+ signals evoked by 5 mm caffeine. Colors correspond to relative Ca2+ changes indicated by the color scale below. B, Left, Two-photon image of a segment of dendrite and spines from a NonTg CA1 pyramidal neuron at rest. Right, Pseudocolored image of same dendritic region showing relative Ca2+ changes after caffeine application. C, Same as in A but from a 3xTg-AD neuron. D, Same as in B but from a 3xTg-AD neuron. E, Bar graphs comparing averaged maximal Ca2+ changes in the soma (left), dendrite (middle), and spine heads (right) between NonTg and 3xTg-AD CA1 pyramidal neurons. *p < 0.05, significantly different from NonTg within anatomical subregions,. F, Representative traces of spontaneous postsynaptic potentials recorded from CA1 pyramidal neurons from NonTg (top) and 3xTg-AD mice (bottom) in control aCSF (left) and 5 mm caffeine (right). G, Cumulative probability histograms demonstrating that caffeine increases the amplitude (left) and frequency (right) of spontaneous potentials only in the 3xTg-AD mice (K–S test, p < 0.05). H, Bar graphs show averaged amplitude (left) and frequency (right) values of spontaneous postsynaptic potentials for NonTg (black) and 3xTg-AD (gray) neurons in control aCSF (solid) or 5 mm caffeine (stripes). Caffeine significantly increased both amplitude and frequency measurements in the 3xTg-AD neurons relative to all NonTg conditions, *p < 0.05.
Figure 2.
Figure 2.
Upregulation of the RyR2 isoform in 3xTg-AD hippocampus. Bar graphs show relative mRNA expression levels of RyR1 (top), RyR2 (middle), and RyR3 (bottom) isoforms from the hippocampus of NonTg (black) and 3xTg-AD (gray) mice. To the right of each graph are the PCR products detected on an agarose gel along with relevant positive and negative controls for each RyR isoform. mRNA levels are relative to control Cyclophilin A levels. *p < 0.05, significantly different from NonTg levels. Error bars represent ±SEM.
Figure 3.
Figure 3.
Basal synaptic transmission properties of CA3–CA1 Schaffer collaterals recorded from 6- to 8-week-old NonTg and 3xTg-AD mice. A, Top, Representative I/O traces show changes in fEPSP amplitude with increasing stimulus intensity for NonTg (black) and 3xTg-AD (gray) mice. Bottom, I/O function shows changes in fEPSP slope with increasing stimulus intensity (0–225 μA) for NonTg (black circles; n = 15) and 3xTg-AD (gray squares; n = 25) mice. B, PPF was measured at an interstimulus interval of 50 ms. Top, Representative PPF traces from NonTg (black) and 3xTg-AD (gray) mice. Bottom, Bar graphs show paired pulse ratio for NonTg (black; n = 21) and 3xTg-AD (gray; n = 33) mice. C, Top, Representative fEPSP traces before (1) and after (2) induction of LTP from NonTg (black; n = 7) and 3xTg-AD (gray; n = 6) mice. Bottom, Graph shows averaged time course of LTP. Baseline fEPSPs were recorded for 20 min at 0.05 Hz before and for 60 min at 0.05 Hz after induction of LTP. The arrow indicates the time of tetanus (2 trains at 100 Hz, 10 s apart). Error bars represent ±SEM, and n denotes number of slices.
Figure 4.
Figure 4.
Disparity in the contribution of RyR-mediated ER Ca2+ stores to synaptic transmission in NonTg and 3xTg-AD mice. A–F, Top, Representative I/O traces show changes in fEPSP amplitude with increasing stimulus intensity for NonTg mice (A, black) and 3xTg-AD mice (B, gray) before and after treatment with 10 μm dantrolene, for NonTg mice (D, black) and 3xTg-AD mice (E, gray) before and after treatment with 1 μm apamin, and for 3xTg-AD mice (F, gray) before and after treatment with 10 μm dantrolene at low stimulus intensity (0–20 μA). Bottom, I/O function shows changes in fEPSP slope with increasing stimulus intensity for NonTg mice before (A, filled black circles; n = 5) and after (open black circles) and for 3xTg-AD mice before (B, filled gray squares; n = 9) and after (open gray squares), and comparing NonTg (C) (open black circles) and 3xTg-AD (open gray squares) mice after treatment with 10 μm dantrolene, for NonTg mice before (filled black circles; n = 3) and after (open black circles) (D), and 3xTg-AD mice before (filled gray squares; n = 4) and after (open gray squares) (E) treatment with 1 μm apamin. F, I/O function shows changes in fEPSP slope at low stimulus intensity (0–20 μA) for 3xTg-AD mice before (filled gray squares; n = 3) and after (open gray squares) treatment with 10 μm dantrolene. G–I, PPF was measured at an interstimulus interval of 50 ms. Top, Representative PPF traces from NonTg (G, black) and 3xTg-AD (H, gray) mice before (1) and after (2) and comparing NonTg (black) and 3xTg-AD (gray) mice (I) after treatment with 10 μm dantrolene. Bottom, Bar graphs show paired pulse ratio for NonTg (n = 5) (G) and 3xTg-AD (n = 9) (H) before (black and dark gray, respectively) and after (white and light gray, respectively), and comparing NonTg (white) and 3xTg-AD (light gray) mice after treatment with 10 μm dantrolene (I). * indicates significantly different from 3xTg-AD before dantrolene treatment. ** indicates significantly different from NonTg. Error bars represent ±SEM, p < 0.05, and n denotes the number of slices.
Figure 5.
Figure 5.
RyR-mediated ER Ca2+ stores contribute differently to LTP in NonTg and 3xTg-AD mice. A, Graph shows changes in baseline fEPSP slope from NonTg (black circles; n = 7) and 3xTg-AD (gray squares; n = 5) mice after treatment with 10 μm dantrolene. B, Bar graph shows fEPSP slope of pretetanus (white and light gray, respectively) and posttetanus (black and gray hatched, respectively) baselines in the presence of dantrolene as percentage of predantrolene baseline (black and dark gray, respectively) in NonTg and 3xTg-AD mice. C, Top, Representative pretetanus fEPSP traces before (1) and after (2) treatment with dantrolene and posttetanus fEPSP traces (3) with dantrolene from NonTg (black) and 3xTg-AD (gray) mice. Bottom, Graph shows averaged time course of LTP with predrug baseline, pretetanic, and posttetanic baseline with dantrolene treatment from NonTg (black circles) and 3xTg-AD (gray squares) mice. The black arrow indicates the time of tetanus. * indicates significantly different from 3xTg-AD before dantrolene treatment. Error bars represent ±SEM, p < 0.05, and n denotes the number of slices.
Figure 6.
Figure 6.
Strong synaptic stimulation differentially recruits RyR-Ca2+ stores in an activity-dependent manner in 3xTg-AD mice. A–C, PPF was measured at an interstimulus interval of 50 ms at a stimulus intensity of 75 μA. This stimulus intensity evoked maximal fEPSP slope responses. The fEPSP slope responses evoked at higher stimulus intensities were not significantly greater than those at 75 μA. Top, Representative PPF traces from NonTg (A, black) and 3xTg-AD (B, gray) mice before (1) and after (2) and comparing NonTg (black) and 3xTg-AD (gray) mice after treatment with 10 μm dantrolene (C). Bottom, Bar graphs show paired pulse ratio for NonTg (n = 4) (A) and 3xTg-AD (n = 4) (B) mice before (black and dark gray, respectively) and after (white and light gray, respectively) and comparing NonTg (white) and 3xTg-AD (light gray) mice after treatment with 10 μm dantrolene (C). D, Left, Graph shows changes in baseline fEPSP slope from NonTg (black circles; n = 4) and 3xTg-AD (gray squares; n = 5) mice after treatment with 10 μm dantrolene at a stimulus intensity of 75 μA. Right, Representative fEPSP traces from NonTg (black) and 3xTg-AD (gray) mice before (1) and after (2) treatment with dantrolene. Error bars represent ±SEM, and n denotes number of slices.
Figure 7.
Figure 7.
Effect of activating RyR-mediated ER Ca2+ stores on synaptic transmission in NonTg and 3xTg-AD mice. A–C, Top, Representative I/O traces show changes in fEPSP amplitude with increasing stimulus intensity for NonTg mice (A, black) and for 3xTg-AD mice (B, gray) before and after treatment with 5 mm caffeine. Bottom, I/O function shows changes in fEPSP slope with increasing stimulus intensity (0–225 μA) for NonTg mice before (A) (filled black circles; n = 5) and after (open black circles), for 3xTg-AD mice before (filled gray squares; n = 6) and after (open gray squares) (B), and comparing NonTg (open black circles) and 3xTg-AD (open gray squares) mice after treatment with 5 mm caffeine (C). D–F, PPF was measured at an interstimulus interval of 50 ms. Top, Representative PPF traces from NonTg (D, black) and 3xTg-AD (E, gray) mice before (1) and after (2) and comparing NonTg (black) and 3xTg-AD (gray) mice after treatment with 5 mm caffeine (F). Bottom, Bar graphs show paired pulse ratio for NonTg (n = 5) (D) and 3xTg-AD (n = 9) (E) mice before (black and dark gray, respectively) and after (white and light gray, respectively) and comparing NonTg (white) and 3xTg-AD (light gray) mice after treatment with 5 mm caffeine (F). * indicates significantly different from NonTg before caffeine treatment. ** indicates significantly different from 3xTg-AD before caffeine treatment. *** indicates significantly different from NonTg. Error bars represent ±SEM, p < 0.05, and n denotes the number of slices.
Figure 8.
Figure 8.
Effect of activating RyR-mediated ER Ca2+ stores on LTP in NonTg and 3xTg-AD mice. A, Graph shows changes in baseline fEPSP slope from NonTg (black circles; n = 4) and 3xTg-AD (gray squares; n = 4) mice after treatment with 5 mm caffeine. B, Bar graph shows fEPSP slope of pretetanus (white and light gray, respectively) and posttetanus (black and gray hatched, respectively) baselines in presence of caffeine as percentage of precaffeine baseline (black and dark gray, respectively) in NonTg and 3xTg-AD mice. C, Top, Representative pretetanus fEPSP traces before (1) and after (2) treatment with caffeine and posttetanus fEPSP traces (3) with caffeine from NonTg (black) and 3xTg-AD (gray) mice. Bottom, Graph shows averaged time course of LTP with predrug baseline and pretetanic and posttetanic baseline with caffeine treatment from NonTg (black circles) and 3xTg-AD (gray squares) mice. D, Top, Representative pretetanus fEPSP traces before (1) and after (2) treatment with caffeine and posttetanus fEPSP traces (3) with caffeine from NonTg mice (black). Bottom, Graph shows averaged time course of LTP with predrug baseline and pretetanic and posttetanic baseline with caffeine treatment from NonTg mice (black circles; n = 4). Here, the stimulus intensity was adjusted so that the fEPSP size after caffeine treatment matched the precaffeine fEPSP size. The tetanus was applied at the readjusted stimulus intensity. The black arrow indicates the time of tetanus. * indicates significantly different from NonTg before caffeine treatment. ** indicates significantly different from 3xTg-AD before caffeine treatment. Error bars represent ±SEM, p < 0.05, and n denotes the number of slices.
Figure 9.
Figure 9.
Adenosine A1 receptors contribute comparably to synaptic transmission and plasticity in NonTg and 3xTg-AD mice. A–C, Top, Representative I/O traces show changes in fEPSP amplitude with increasing stimulus intensity for NonTg mice (A, black) and for 3xTg-AD mice (B, gray) before and after treatment with 1 μm DPCPX. Bottom, I/O function shows changes in fEPSP slope with increasing stimulus intensity (0–225 μA) for NonTg mice before (filled black circles; n = 7) and after (open black circles) (A), for 3xTg-AD mice before (filled gray squares; n = 4) and after (open gray squares) (B), and comparing NonTg (open black circles) and 3xTg-AD (open gray squares) mice after treatment with 1 μm DPCPX (C). D–F, PPF was measured at an interstimulus interval of 50 ms. Top, Representative PPF traces from NonTg (D, black) and 3xTg-AD (E, gray) mice before (1) and after (2) and comparing NonTg (black) and 3xTg-AD (gray) mice after treatment with 1 μm DPCPX (F). Bottom, Bar graphs show paired pulse ratio for NonTg (n = 8) (D) and 3xTg-AD (n = 9) (E) mice before (black and dark gray, respectively) and after (white and light gray, respectively) and comparing NonTg (white) and 3xTg-AD (light gray) mice after treatment with 1 μm DPCPX (F). G, Graph shows changes in baseline fEPSP slope from NonTg (black circles; n = 4) and 3xTg-AD (gray squares; n = 4) mice after treatment with 1 μm DPCPX. H, Top, Representative pretetanus fEPSP traces before (1) and after (2) treatment with DPCPX and posttetanus fEPSP traces (3) with DPCPX from NonTg (black) and 3xTg-AD (gray) mice. Bottom, Graph shows averaged time course of LTP with predrug baseline and pretetanic and posttetanic baseline with DPCPX treatment from NonTg (black circles) and 3xTg-AD (gray squares) mice. The black arrow indicates the time of tetanus. Error bars represent ±SEM, p > 0.05, and n denotes the number of slices.

Similar articles

Cited by

References

    1. Alford S, Frenguelli BG, Schofield JG, Collingridge GL. Characterization of Ca2+ signals induced in hippocampal CA1 neurons by the synaptic activation of NMDA receptors. J Physiol. 1993;469:693–716. - PMC - PubMed
    1. Bardo S, Cavazzini MG, Emptage N. The role of endoplasmic reticulum calcium stores in the plasticity of central neurons. Trends Pharmacol Sci. 2006;27:78–84. - PubMed
    1. Berridge MJ. Neuronal calcium signaling. Neuron. 1998;21:13–26. - PubMed
    1. Bliss TV, Collingridge GL. A synaptic model of memory: LTP in the hippocampus. Nature. 1993;361:31–39. - PubMed
    1. Bouchard R, Pattarini R, Geiger JD. Presence and functional significance of presynaptic ryanodine receptors. Prog Neurobiol. 2003;69:391–418. - PubMed

MeSH terms