. 2009 Sep;20(9):2065-74.
doi: 10.1681/ASN.2008121233. Epub 2009 Jul 30.

Urinary peptidome may predict renal function decline in type 1 diabetes and microalbuminuria

Affiliations

Urinary peptidome may predict renal function decline in type 1 diabetes and microalbuminuria

Michael L Merchant et al. J Am Soc Nephrol. 2009 Sep.

Abstract

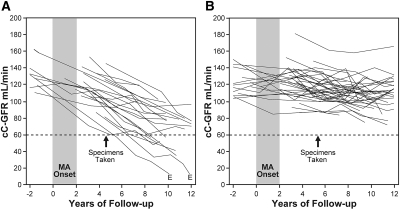
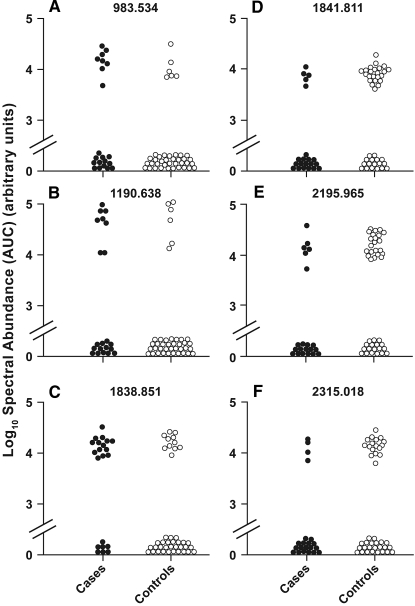
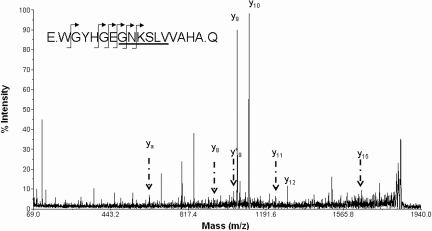
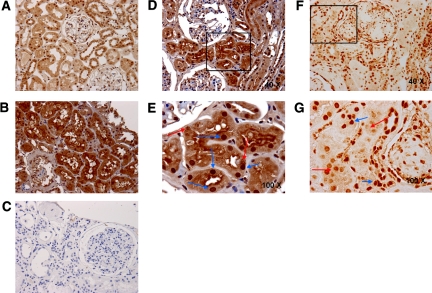
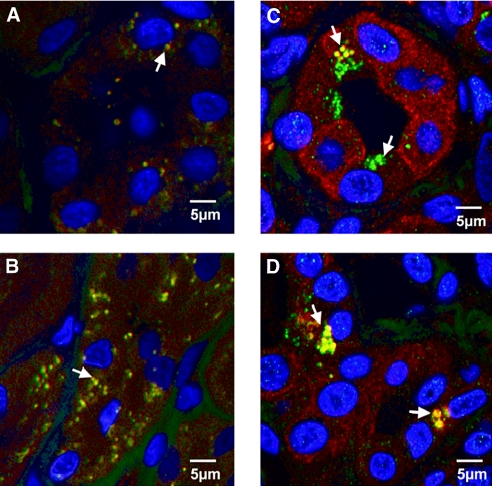
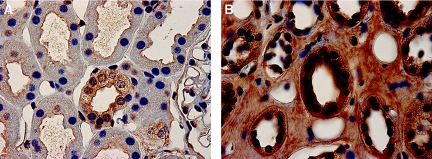
One third of patients with type 1 diabetes and microalbuminuria experience an early, progressive decline in renal function that leads to advanced stages of chronic kidney disease and ESRD. We hypothesized that the urinary proteome may distinguish between stable renal function and early renal function decline among patients with type 1 diabetes and microalbuminuria. We followed patients with normal renal function and microalbuminuria for 10 to 12 yr and classified them into case patients (n = 21) with progressive early renal function decline and control subjects (n = 40) with stable renal function. Using liquid chromatography matrix-assisted laser desorption/ionization time-of-flight mass spectrometry, we identified three peptides that decreased in the urine of patients with early renal function decline [fragments of alpha1(IV) and alpha1(V) collagens and tenascin-X] and three peptides that increased (fragments of inositol pentakisphosphate 2-kinase, zona occludens 3, and FAT tumor suppressor 2). In renal biopsies from patients with early nephropathy from type 1 diabetes, we observed increased expression of inositol pentakisphosphate 2-kinase, which was present in granule-like cytoplasmic structures, and zona occludens 3. These results indicate that urinary peptide fragments reflect changes in expression of intact protein in the kidney, suggesting new potential mediators of diabetic nephropathy and candidate biomarkers for progressive renal function decline.


Figures

Figure 1.
Figure 1.
Patterns of changes in estimates of cC-GFR in patients with type 1 diabetes and new-onset MA during 10 to 12 yr of follow-up. cC-GFR was estimated using serum concentration of cystatin C and the formula of Macisaac et al., and changes in renal function were estimated by slopes. (A and B) Patients were divided into two study groups: those with early renal function decline (decliners) when cC-GFR loss was ≥3.3%yr (A) and stable renal function (nondecliners) when cC-GFR loss was <3.3%yr (B). E, ESRD. Arrows indicate examinations from which urine samples were used for peptide component analysis.
Figure 2.
Figure 2.
Distribution of peptide abundance in case and control urine. Aligned MS data sets were constructed from peptide mass and retention time, and peptide spectral abundance was calculated from the MS ion cluster area. Peptide abundance in all samples is presented. The difference in frequency of urine peptides between cases and controls was determined using Fisher exact test. All peptides shown were significantly different between case and control groups.
Figure 3.
Figure 3.
Analysis of peptide fragmentation spectra and assignment to candidate proteins. The fragmentation spectrum for 1838.851 m/z is assigned to a 16–amino acid fragment of IPP2K after analysis by Matrix Science Mascot with subsequent manual review. The candidate peptide sequence is shown (inset) with arrows marking observed y and y* ions. The underlined sequence is inferred by prominent ya internal fragment. No b ions were observed. Mass data for observed y, y*, and ya (internal) ions are inclusive of a glycyl-glycyl modification to the ε amino group of the internal lysine amino acid.
Figure 4.
Figure 4.
IPP2K renal expression is increased in the renal parenchyma of patients with type 1 diabetes and minimal nephropathy. (A through C) Immunohistochemical localization of IPP2K in a control kidney biopsy specimen (A); type 1 diabetes biopsy specimen (B); and secondary antibody negative control (C) demonstrates increased renal tubular cytoplasmic, nuclear, and perinuclear IPP2K staining within the diabetic phenotype. (D and E) Further experiments for IPP2K (D) and TIA1 (E) were conducted in type 1 diabetes biopsy specimens. Blue arrows identify regions of nuclear staining; red arrows identify regions of punctate cytoplasmic staining. Unless otherwise noted, the presented image is at a . Images are representative of experiments performed in four sets of normal and diabetic kidney. Magnifications: ×40 in A, B, C, D, and F; ×100 in E and G.
Figure 5.
Figure 5.
Co-localization of stress granule proteins IPPK and TIA1 in proximal tubules of human renal biopsies. Co-localization of IPP2K and TIA1 in proximal tubules of human renal biopsies. (A through D) Representative fluorescence images of control (A and B) and early type 1 diabetic (C and D) renal biopsies stained for IPP2K (red fluorescence) and TIA1 (green fluorescence). Nuclei are stained with DAPI. Arrows indicate structures staining for co-localized TIA1 and IPP2K and appear as a yellow pseudocolor. Diabetic sections stain more intensely for cytoplasmic IPP2K. IPPK in diabetic sections is co-localized with TIA1 in larger granular structures. Images are representative of three sets of normal and diabetic renal biopsies.
Figure 6.
Figure 6.
Cytoplasmic ZO-3 expression and cell junction staining are increased in renal biopsies of patients with diabetes and minimal nephropathy. (A and B) Control (A) and diabetic (B) renal biopsy sections stained for ZO-3 demonstrated enhanced staining for ZO-3 in the cytoplasm of diabetic biopsy sections and prominent, dense staining in the apical membrane of renal proximal tubular cells and in sites of cell–cell interaction within renal tubules and were taken to be diagnostic of tubular adherens junctions. Images are representative of experiments performed in four sets of normal and diabetic kidney.

References

    1. Viberti GC, Hill RD, Jarrett RJ, Argyropoulos A, Mahmud U, Keen H:Microalbuminuria as a predictor of clinical nephropathy in insulin-dependent diabetes mellitus. Lancet 1: 1430–1432, 1982 - PubMed
    1. Mogensen CE, Keane WF, Bennett PH, Jerums G, Parving HH, Passa P, Steffes MW, Striker GE, Viberti GC:Prevention of diabetic renal disease with special reference to microalbuminuria. Lancet 346: 1080–1084, 1995 - PubMed
    1. Perkins BA, Ficociello LH, Silva KH, Finkelstein DM, Warram JH, Krolewski AS:Regression of microalbuminuria in type 1 diabetes. N Engl J Med 348: 2285–2293, 2003 - PubMed
    1. Giorgino F, Laviola L, Cavallo Perin P, Solnica B, Fuller J, Chaturvedi N:Factors associated with progression to macroalbuminuria in microalbuminuric type 1 diabetic patients: The EURODIAB Prospective Complications Study. Diabetologia 47: 1020–1028, 2004 - PubMed
    1. Araki S, Haneda M, Sugimoto T, Isono M, Isshiki K, Kashiwagi A, Koya D:Factors associated with frequent remission of microalbuminuria in patients with type 2 diabetes. Diabetes 54: 2983–2987, 2005 - PubMed

Publication types

MeSH terms