Reduced CD38 expression on CD34+ cells as a diagnostic test in myelodysplastic syndromes
- PMID: 19644143
- PMCID: PMC2719039
- DOI: 10.3324/haematol.2008.004085
Reduced CD38 expression on CD34+ cells as a diagnostic test in myelodysplastic syndromes
Abstract
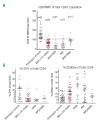
Diagnosis of myelodysplastic syndrome can be difficult especially in cases with a low blast count and a normal karyotype. Flow cytometry has been used to distinguish myelodysplastic syndrome from non-clonal cytopenias. No one single simple flow cytometric parameter has been proposed to be diagnostic of myelodysplastic syndrome. We have studied samples from 100 myelodysplastic syndrome patients and as control samples; 70 non-clonal cytopenias, 5 subjects with normal hematology, 31 patients with acute myeloid leukemia and 11 with chronic myelomonocytic leukemia or myeloproliferative disorder. We show that reduced relative mean fluorescence of CD38 below a threshold value on CD34(+) cells diagnosed low-grade myelodysplastic syndrome with 95% sensitivity (95% confidence interval, 87-99%) and 92% specificity (95% confidence interval, 82-97%). This simple flow cytometric test may be of value in the routine clinical diagnosis of myelodysplastic syndrome, especially in cases with a low blast count and normal karyotype.
Figures


Comment in
-
Flow cytometry immunophenotyping for diagnosis of myelodysplastic syndrome.Haematologica. 2009 Aug;94(8):1041-3. doi: 10.3324/haematol.2009.007682. Haematologica. 2009. PMID: 19644135 Free PMC article.
References
-
- Heaney ML, Golde DW. Myelodysplasia. N Engl J Med. 1999;340:1649–60. - PubMed
-
- Nimer SD. Myelodysplastic syndromes. Blood. 2008;111:4841–51. - PubMed
-
- Stetler-Stevenson M, Arthur DC, Jabbour N, Xie XY, Molldrem J, Barrett AJ, et al. Diagnostic utility of flow cytometric immunophenotyping in myelodysplastic syndrome. Blood. 2001;98:979–87. - PubMed
-
- Del Canizo MC, Fernandez ME, Lopez A, Vidriales B, Villaron E, Arroyo JL, et al. Immunophenotypic analysis of myelodysplastic syndromes. Haematologica. 2003;88:402–7. - PubMed
-
- Wells DA, Benesch M, Loken MR, Vallejo C, Myerson D, Leisenring WM, et al. Myeloid and monocytic dyspoiesis as determined by flow cytometric scoring in myelodysplastic syndrome correlates with the IPSS and with outcome after hematopoietic stem cell transplantation. Blood. 2003;102:394–403. - PubMed
Publication types
MeSH terms
Substances
Grants and funding
LinkOut - more resources
Full Text Sources
Medical
Research Materials

