. 2009 Sep 2;28(17):2662-76.
doi: 10.1038/emboj.2009.205. Epub 2009 Jul 30.

The structure of myostatin:follistatin 288: insights into receptor utilization and heparin binding

Affiliations

The structure of myostatin:follistatin 288: insights into receptor utilization and heparin binding

Jennifer N Cash et al. EMBO J. .

Abstract

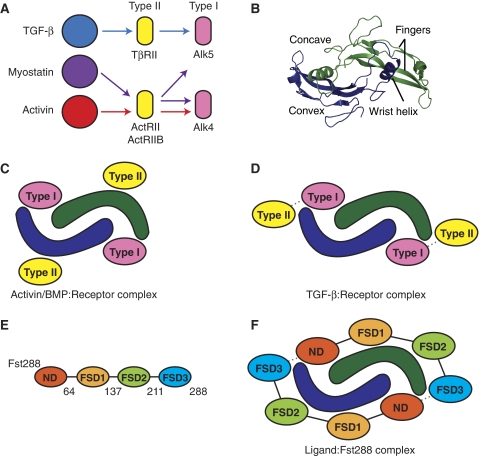
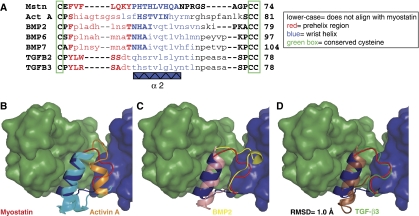
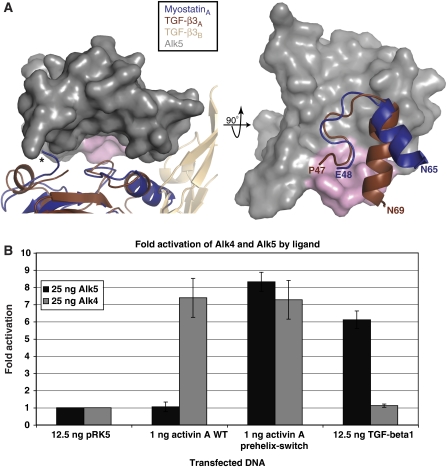
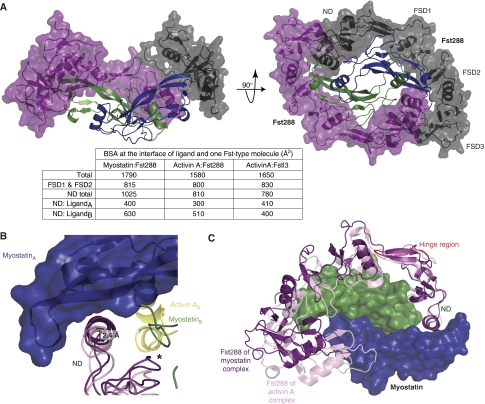
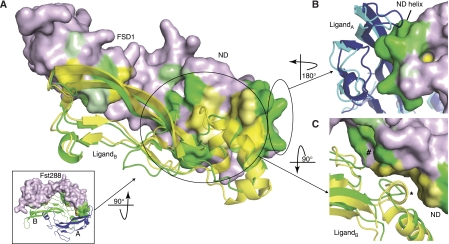
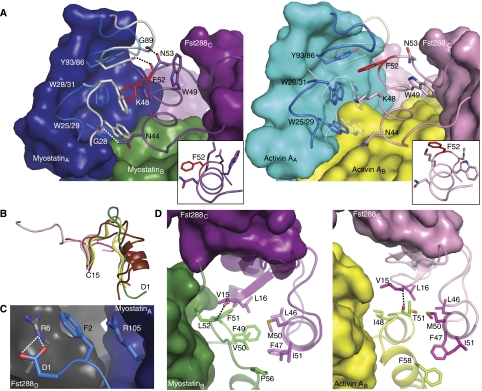
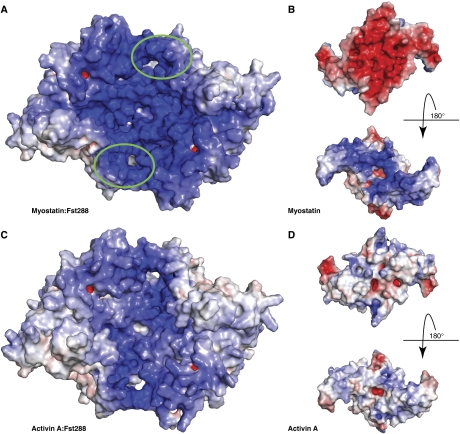
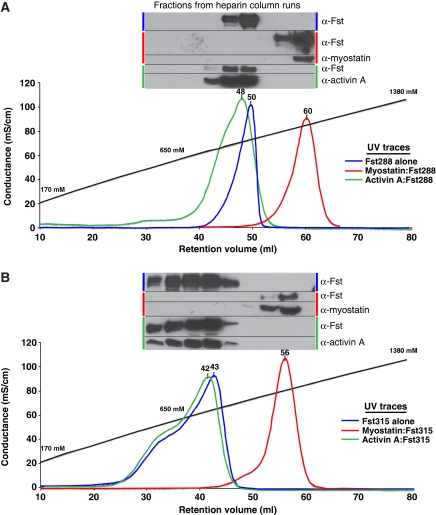
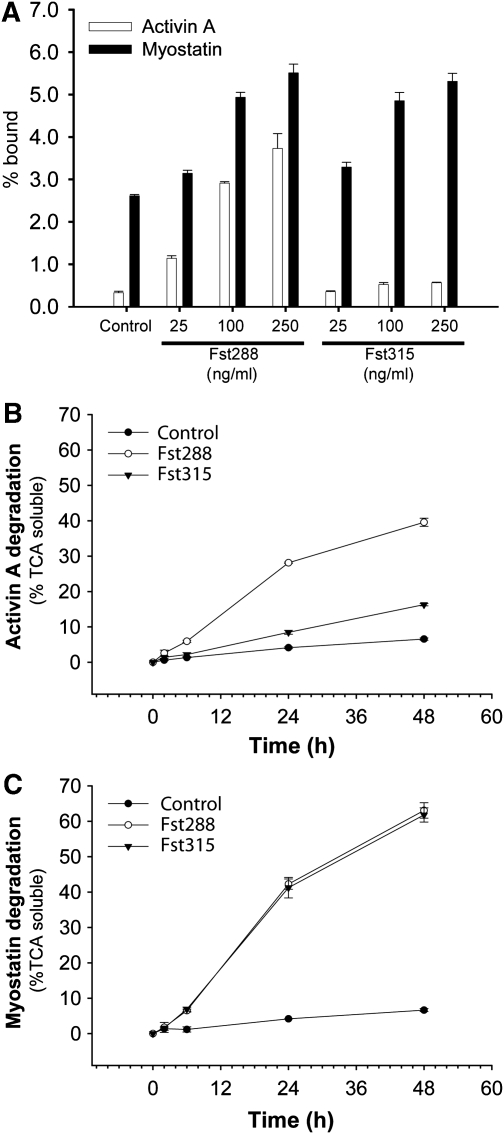
Myostatin is a member of the transforming growth factor-beta (TGF-beta) family and a strong negative regulator of muscle growth. Here, we present the crystal structure of myostatin in complex with the antagonist follistatin 288 (Fst288). We find that the prehelix region of myostatin very closely resembles that of TGF-beta class members and that this region alone can be swapped into activin A to confer signalling through the non-canonical type I receptor Alk5. Furthermore, the N-terminal domain of Fst288 undergoes conformational rearrangements to bind myostatin and likely acts as a site of specificity for the antagonist. In addition, a unique continuous electropositive surface is created when myostatin binds Fst288, which significantly increases the affinity for heparin. This translates into stronger interactions with the cell surface and enhanced myostatin degradation in the presence of either Fst288 or Fst315. Overall, we have identified several characteristics unique to myostatin that will be paramount to the rational design of myostatin inhibitors that could be used in the treatment of muscle-wasting disorders.


Conflict of interest statement

The authors declare that they have no conflict of interest.

Figures

Figure 1
Figure 1
Receptor and antagonist interactions with TGF-β family ligands. (A) Receptor specificity within the TGF-β family. Type I receptor signalling that specifically causes activation of Smads 2 and 3. Myostatin is distinctive in that it can effectively signal through both Alk4 and Alk5. (B) Architecture of TGF-β family ligands, showing myostatin. (C) During activin or BMP signalling, type II receptors typically bind on the convex surface of the ligand, whereas type I receptors bind on the concave surface. (D) In contrast, during TGF-β signalling, type II receptors bind more distally on the ligand, towards the fingertip region. There are also contacts between the type II and type I receptors. (E) Domain layout of Fst288, with the last residue of each domain indicated. (F) Schematic of ligand antagonism by Fst288. Two Fst288 molecules completely surround the ligand, blocking all four receptor-binding sites. Additional interactions occur between the ND of one Fst288 molecule and FSD3 of the other.
Figure 2
Figure 2
The prehelix loop of myostatin is most similar to that of the TGF-β class. (A) Structure-based sequence alignment against myostatin. (BD) Myostatin monomer A (myostatinA, blue) and monomer B (myostatinB, green) are shown, with monomers B aligned between ligands. Superimposed on myostatin are the wrist regions of the other ligands: activin A (2B0U) in cyan and orange, BMP2 (2H64) in pink and yellow, and TGF-β3 (2PJY) in brown and green (Thompson et al, 2005; Weber et al, 2007; Groppe et al, 2008). An RMSD value for main chain atoms of the prehelix regions of myostatin (residues 49–55) and TGF-β3 (residues 50–56) is shown.
Figure 3
Figure 3
The conformation of the prehelix region of myostatin is a feature that allows signalling through Alk5. (A) MyostatinA and TGF-β3A are aligned, with Alk5 (grey) superimposed (2PJY (Groppe et al, 2008)). The N-terminus of myostatin is indicated (*). (B) Luciferase-reporter gene assay with the CAGA12 promoter in L17 RIB cells. Reporter activation was monitored after cells were transfected with and without Alk4 or Alk5 receptors along with various plasmids containing ligands. Substituting the prehelix region of activin A with that of myostatin creates a ligand (activin A prehelix-switch) with a greatly increased ability to signal through Alk5. Fold activation represents response to ligand with receptor transfected over response with no ligand transfected, after subtracting background of the transfected ligand without added receptor.
Figure 4
Figure 4
Overview of the myostatin:Fst288 structure with gross comparisons to activin A:Fst-type structures. (A) Overview of the myostatin:Fst288 structure. The ND and FSD1 are removed from one chain (black) in the left panel. Interface buried surface area calculations are shown in the table. Activin A:Fstl3 complex calculations are shown for comparison. LigandA (e.g. myostatinA) refers to the ligand monomer opposite the ND, whereas ligandB refers to the monomer adjacent to the ND. (B) MyostatinA and activin AA in the myostatin:Fst288 (blue, green: purple) and activin A:Fst288 (yellow: pink) complexes are aligned. Activin AA is not shown. The Fst288 ND helix is 2.4 Å closer to myostatinA than activin AA. An asterisk indicates where the ND of Fst288 in the myostatin complex would overlap with the prehelix region of activin A. (C) NDs of one Fst288 molecule in each of the two complexes are aligned. Activin A and one Fst288 molecule from each complex are not shown. A hinge region directly following the ND in residues 64–74 of FSD1 is highlighted (red).
Figure 5
Figure 5
Buried surface area comparison between myostatin:Fst288 and activin A:Fst288. Myostatin (green and dark blue) and activin A (yellow and cyan) use different areas on Fst288. (A) NDs of one Fst288 from each complex are aligned. Inset shows myostatin in complex with one Fst288 molecule (FSD2 and FSD3 are removed) and is used for orientation. Fst288 is coloured according to which ligand buries more of its surface in specific areas. Fst288 residues that are buried more in the activin A:Fst288 complex are shaded brighter yellow, whereas those that are buried more in the myostatin:Fst288 complex are shaded brighter green. The strongest shades represent buried surface area differences of up to 45 Å2. Areas that are either not buried or buried equally by both ligands are tinted light purple. Differences in buried surface areas were calculated between the two complexes on a per residue basis. (B) The ND helix forms a closer contact with the fingertip area of myostatin (see also Figure 6A). (C) The N-terminus of myostatin forms novel contacts with Fst288 (#, see also Figure 6C), whereas activin A buries more surface area through its prehelix region (*, see also Figure 6D).
Figure 6
Figure 6
Fst288 ND contact differences between myostatin and activin A. (A) Comparison of the Fst288 ND helix interactions with myostatin (left) and activin A (right). Residues shown in stick are carved out of the surface for clarity. Superimposed on myostatin and activin A are the fingertip regions of the other ligand (transparent). The ND helix is shifted closer to myostatinA as compared with activin AA, allowing additional hydrophobic interactions and three hydrogen bonds to be formed at the ND helix:fingertip interface (in both panels shown in cartoon and stick). Comparing the two complexes, a shift occurs in the conformation and hydrogen bonding within the ND helix (inset), specifically altering the position of F52 (red). Helices are shown from the same perspective, with the NDs aligned. (B) Comparison of the N-termini of different TGF-β ligands up through the first conserved cysteine. BMPs are shown in shades of pink (1M4U 28–38, 2H64 10–14, 2QCQ 4–8, and 2R53 26–31), TGF-βs in shades of brown (2PJY 1–15 and 2TGI 1–15), activin A in shades of yellow (2ARV 1–11 and 2B0U 1–11), and myostatin in green (annotated 1–15) (Daopin et al, 1992; Groppe et al, 2002, 2008; Thompson et al, 2005; Harrington et al, 2006; Allendorph et al, 2007; Weber et al, 2007; Saremba et al, 2008). (C) The N-terminus of myostatin (blue) forms a stabilizing cation-π interaction with Fst288 (grey), which is distinctive from activin A. (D) Activin A (right) fills a crevice on the ND of Fst288 with its prehelix region. Both ligands form a backbone hydrogen bond here, but myostatin (left) presents more hydrophobic residues on its prehelix loop to form additional interactions with those of Fst288.
Figure 7
Figure 7
Myostatin exhibits a unique double-sided electrostatic surface potential. (A, C) Surface representation of the electrostatic potential of Fst288 in complex with myostatin and activin A. Surfaces are coloured by potential on the solvent accessible surface on a scale of −12.5 to 12.5 kbT/ec (red to blue). The heparin-binding site in FSD1 is circled in green. The myostatin:Fst288 complex exhibits a strikingly electropositive surface, especially in comparison to the same surface on the activin A:Fst288 complex. (B, D) Electrostatic surface potential of individual ligands coloured on a scale of −5 to 5 kbT/ec. The myostatin dimer itself actually shows an extremely polar electrostatic surface potential. Activin A is shown for comparison.
Figure 8
Figure 8
Myostatin greatly increases the affinity of Fst for heparin compared with Fst alone or activin A:Fst complexes. Fst288 (A) and Fst315 (B) alone and in complex with ligands were bound to a heparin column and eluted with a NaCl gradient. Y axis is shown in terms of conductance, and the approximate corresponding NaCl concentration is labelled along the gradient. Peaks traces are in terms of absorbance at 280 nm, and retention volumes are shown above each peak. Western blots were performed on every other fraction collected, and samples are pictured above the peaks they represent.
Figure 9
Figure 9
Both Fst288 and Fst315 enhance myostatin cell surface binding and degradation. (A) 2 nM 125I-activin A or 125I-myostatin were incubated in the presence or absence of varying amounts of Fst288 and Fst315 and added to LβT2 cells for 2 h as described. Cell surface binding was calculated as the fraction of radioactive ligand that remained cell-associated after washing. (B, C) The effect of 250 ng/ml Fst288 or Fst315 on degradation of 1 nM radio-labelled activin A (B) or myostatin (C) in LβT2 cells as assessed by the TCA soluble fraction and measured as a function of time.

References

    1. Allendorph GP, Isaacs MJ, Kawakami Y, Belmonte JC, Choe S (2007) BMP-3 and BMP-6 structures illuminate the nature of binding specificity with receptors. Biochemistry 46: 12238–12247 - PubMed
    1. Allendorph GP, Vale WW, Choe S (2006) Structure of the ternary signaling complex of a TGF-β superfamily member. Proc Natl Acad Sci USA 103: 7643–7648 - PMC - PubMed
    1. Amthor H, Nicholas G, McKinnell I, Kemp CF, Sharma M, Kambadur R, Patel K (2004) Follistatin complexes myostatin and antagonises myostatin-mediated inhibition of myogenesis. Dev Biol 270: 19–30 - PubMed
    1. Andersson O, Reissmann E, Ibanez C (2006) Growth differentiation factor 11 signals through the transforming growth factor-β receptor ALK5 to regionalize the anterior-posterior axis. EMBO Rep 7: 831–837 - PMC - PubMed
    1. Attisano L, Carcamo J, Ventura F, Weis FM, Massague J, Wrana JL (1993) Identification of human activin and TGF β type I receptors that form heteromeric kinase complexes with type II receptors. Cell 75: 671–680 - PubMed

Publication types