. 2009 Aug 25;48(33):7878-91.
doi: 10.1021/bi9006447.

The partial substrate dethiaacetyl-coenzyme A mimics all critical carbon acid reactions in the condensation half-reaction catalyzed by Thermoplasma acidophilum citrate synthase

Affiliations

The partial substrate dethiaacetyl-coenzyme A mimics all critical carbon acid reactions in the condensation half-reaction catalyzed by Thermoplasma acidophilum citrate synthase

Linda C Kurz et al. Biochemistry. .

Abstract

Citrate synthase (CS) performs two half-reactions: the mechanistically intriguing condensation of acetyl-CoA with oxaloacetate (OAA) to form citryl-CoA and the subsequent, slower hydrolysis of citryl-CoA that generally dominates steady-state kinetics. The condensation reaction requires the abstraction of a proton from the methyl carbon of acetyl-CoA to generate a reactive enolate intermediate. The carbanion of that intermediate then attacks the OAA carbonyl to furnish citryl-CoA, the initial product. Using stopped-flow and steady-state fluorescence methods, kinetic substrate isotope effects, and mutagenesis of active site residues, we show that all of the processes that occur in the condensation half-reaction performed by Thermoplasma acidophilum citrate synthase (TpCS) with the natural thioester substrate, acetyl-CoA, also occur with the ketone inhibitor dethiaacetyl-CoA. Free energy profiles demonstrate that the nonhydrolyzable product of the condensation reaction, dethiacitryl-CoA, forms a particularly stable complex with TpCS but not pig heart CS.


Figures

Figure 1
Figure 1
A working hypothesis for the CS condensation half-reaction. R is the remainder of CoA. The configuration and expected functions of TpCS active site residues are similar to analogous PCS residues (given in parentheses) (4, 5): Asp317 (Asp375) is the active site base that deprotonates acetyl-CoA during the CS condensation; His 187 (His238) is a nearly pure OAA binding residue (6); His222 (His274) interacts directly with the thioester substrate and its enolate; and His262 (His320) plays an indirect role (7) (unpublished observations). The potential of His262 to function as a general acid during the alcohol-forming step is unclear. IEF analysis of His→Asn mutants (data not shown), crystal structures of CS complexes (8), and pKa computations (9, 10) (L. C. Kurz, unpublished results) all indicate that His262 equivalents are neutral in all characterized CS complexes. Trp348 is primarily responsible for the intrinsic fluorescence of TpCS, which is strongly quenched in the presence of OAA (6). The complex with citryl-CoA has even higher fluorescence than the unliganded enzyme.
Figure 2
Figure 2
Acetyl-CoA, acetyl-CoA enolate, and analogues mentioned in this study. CMCoA and CMX are tight-binding analogues of the acetyl-CoA enolate (–19). R is the remainder of CoA.
Figure 3
Figure 3
Fluorescence emission spectra of TpCS, TM, and W348Y–TpCS, and their binary (E•OAA) or ternary (E•OAA•dethiaacetyl-CoA) complexes. A, Comparison of wild-type TpCS (black traces), which contains four Trp residues (17, 115, 245, and 348) and TM (red traces), a triple mutant, which contains only Trp348. The fluorescence of TpCS forms containing Trp348 (TpCS or TM) is quenched relative to unliganded enzyme (solid lines) by OAA binding (open circles). In contrast, the TpCS•citryl-CoA complex shows enhanced fluorescence, relative to unliganded enzyme (6). At equilibrium, the ternary complex (filled circles) formed by TpCS•OAA•dethiaacetyl-CoA is “dequenched,” that is, it shows reduced quenching. Note that TpCS shows much less quenching in the binary and ternary complexes due to the presence of the secondary emitters Trp245, Trp115, and Trp17, which cause an increase in the fluorescence emission upon the addition of dethiaacetyl-CoA (Panel B). The individual contributions of these three Trp residues to the fluorescence enhancement have not been dissected. B, Spectrum of unliganded TpCS (solid black line) compared to spectra of W348Y–TpCS, a protein containing three Trp residues in which the primary emitter Trp348 has been replaced. Relative to unliganded W348Y–TpCS (blue solid line), the binary (blue open circles) and ternary (blue filled circles) complexes show increased fluorescence emission intensity. The excitation wavelength was 295 nm. Emission spectra were recorded between 305 and 400 nm at 20 °C as described (6). Final concentrations were 1 µM subunit for each enzyme form, with 200 µM OAA, and 25 µM dethiaacetyl-CoA where indicated. Spectra recorded in the absence of ligands were normalized to have the same emission intensity (100 arbitrary units) at 315 nm. Every eighth data point is indicated by the symbols but all data points are connected by lines that reflect the noise in the traces. The quantum yield of W348Y–TpCS is substantially lower than that of TpCS or TM, which is consistent with the role of Trp348 as the primary emitter (6).
Figure 4
Figure 4
Fluorescence titrations of TpCS•OAA with dethiaacetyl-CoA. Titrations of 1.0 µM TpCS subunits in 200 µM OAA were performed at pL = 8.0 and 20 °C in H2O (filled circles) or D2O (open circles). The plotted values represent fluorescence emission intensity, in arbitrary units, at 315 nm. Solid lines are fits to Eqn. 1 with Kd = 1.56 ± 0.04 µM (H2O) or Kd = 0.35 ± 0.03 µM (D2O), corresponding to an equilibrium solvent isotope effect of 4.5 ± 0.5.
Figure 5
Figure 5
pL dependence of Kd values for two “neutral-terminus” acetyl-CoA analogues. TpCS was used to measure the dethiaacetyl-CoA affinity, while TM was used to measure the CAMCoA affinity. While TM binds CoA analogues more loosely than TpCS, there are otherwise no meaningful differences between these two enzyme forms (6). The Kd values for dethiaacetyl-CoA complex formation with TpCS•OAA (filled circles, in H2O; open circles, in D2O) were determined by fluorescence titrations. The Kd values for CAMCoA binding to TM•27;OAA (filled triangles, in H2O; open triangles, in D2O) were determined by CD titrations. For both analogues, pKd values show little dependence on pL. Dethiaacetyl-CoA unweighted linear fits give slope −0.13 ± 0.02 in H2O (thick solid line; R2 = 0.976) and –0.10 ± 0.11 in D2O (thick dashed line; R2 = 0.418). The ratio of fitted values gives a solvent isotope effect (SIE) range for dethiaacetyl-CoA complexation of 3.8 to 4.5, from pL 7 to 9. CAMCoA unweighted linear fits give slope −0.11 ± 0.02 in H2O (thin solid line; R2 = 0.930) and −0.05 ± 0.03 in D2O (thin dotted line; R2 = 0.685). The ratio of fitted values gives a SIE range for CAMCoA binding of 1.8 to 2.4, from pL 7 to 9. Error bars indicate the fitting uncertainty in each pKd determination. A replicate determination for CAMCoA at pH 8 is shown. Note that the ordinate scale is half that of the abscissa.
Figure 6
Figure 6
Reaction of TpCS•;OAA with substoichiometric acetyl-CoA monitored by stopped-flow fluorescence spectroscopy (SFF). TpCS pre-incubated with OAA in one syringe was mixed with acetyl-CoA in the other, giving initial concentrations of 2 µM TpCS, 40 µM OAA, and 0.2 µM acetyl-CoA. The solid blue line is a fit of the data to a two-exponential equation with kobs1 = 96.4 ± 1.4 s−1 and kobs1 = 7.23 ± 0.08 s–1. In a parallel experiment under steady-state conditions, the TpCS kCat was determined to be 6.8 s−1 at saturating acetyl-CoA and OAA. Inset, An enlargement of the fast phase of the reaction comparing acetyl-CoA (black symbols) with [D3]acetyl-CoA (red symbols). The light blue solid line shows a fit of the [D3]acetyl-CoA data to a two-exponential equation with kobs1 = 58.5 ± 0.9 s−1 and kobs2 = 7.2 ± 0.1 s−1. Concentration dependence data for these observed rates are presented in Supporting information, Figure S7. The [D3]acetyl-CoA data have been shifted vertically by −0.1 V.
Figure 7
Figure 7
Reaction of TpCS•OAA with excess dethiaacetyl-CoA monitored by SFF After mixing, the reaction contained 0.2 µM TpCS, 100 µM OAA, and 40 µM dethiaacetyl-CoA (filled circles) at 20 °C and pH 8.0. The solid line is a single-exponential fit to the data with kobs = 50.8 ± 0.1 s−1. A control reaction lacking only dethiaacetyl-CoA shows no fluorescence changes (open circles). A depiction of the complete progress curve showing fitting residuals with a logarithmic time basis is given in Supporting information (Figure S8).
Figure 8
Figure 8
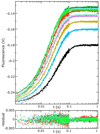
Semi-logarithmic curves showing results of progress-curve fitting for TpCS•OAA (0.2 µM final subunit concentration) complex formation with dethiaacetyl-CoA in H2O. After mixing, the reaction contained 0.2 µM TpCS, 100 µM OAA, and variable dethiaacetyl-CoA at 20 °C and pH 8.0. Data points are shown as small symbols, and fits are shown as solid lines of the same color. From bottom to top (at 1 s), the traces were obtained at 2.05 (black), 4.12, 6.17, 8.23, 10.28, 15.42, 40.14, 30.86, or 20.57 (dark green) µM dethiaacetyl-CoA; note that the last three are out of order due to small differences in the initial offsets. Fit residuals are at the bottom.
Figure 9
Figure 9
Initial rate of the fluorescence increase associated with dethiaacetyl-CoA complex formation with D317G–TpCS•OAA. Dethiaacetyl-CoA was added to 0.5 µM D317G–TpCS subunits previously equilibrated in 75 µM OAA, at pH 8.0 and 20 °C. The appearance of the full fluorescence change (monitored at 315 nm) at each [dethiaacetyl-CoA] is very slow, so it was impractical to wait until the reaction had reached completion. The specific initial rate for the formation of the fluorescence-enhanced product resulting from dethiaacetyl-CoA complex formation with TpCS•OAA was computed as described in Experimental Procedures. The solid line is a fit of Eqn. 2 to the data that yields kmax = (2.50 ± 0.06) × 10−3 s−1 and Kapp = 27 ± 3 µM.
Figure 10
Figure 10
Free energy reaction profiles. The full TpCS profile (pH 8 and 20 °C) is in black and the partial PCS profile (pH 8.2 and 26.5 °C) is in red. The free energy of the enzyme and the free substrates has been arbitrarily assigned a value of zero. Other energy levels, including the activated complexes for each reaction (ac), are given relative to this using a 1 M standard state for reactants with pure water given an activity of 1. Free substrates or products are not listed for the intermediate states, but do contribute to the free energy of each. The free energy values (Table S2 and Table S3) and the method of their determination are detailed in Supporting information.
Scheme 1
Scheme 1
Kinetic model for dethiaacetyl-CoA (L) complex formation with TpCS•OAA (E).

Similar articles

Cited by

References

    1. Guynn RW, Gelberg HJ, Veech RL. Equilibrium constants of the malate dehydrogenase, citrate synthase, citrate lyase, and acetyl coenzyme A hydrolysis reactions under physiological conditions. J. Biol. Chem. 1973;248:6957–6965. - PubMed
    1. Pettersson G, Lill U, Eggerer H. Mechanism of interaction of citrate synthase with citryl-CoA. Eur. J. Biochem. 1989;182:119–124. - PubMed
    1. Kurz LC, Drysdale G, Riley M, Tomar MA, Chen J, Russell RJM, Danson MJ. Kinetics and mechanism of the citrate synthase from the thermophilic archaeon Thermoplasma acidophilum. Biochemistry. 2000;39:2283–2296. - PubMed
    1. Russell RJM, Hough DW, Danson MJ, Taylor GL. The crystal structure of citrate synthase from the thermophilic archaeon, Thermoplasma acidophilum. Structure. 1994;2:1157–1167. - PubMed
    1. Evans CT, Kurz LC, Remington SJ, Srere PA. Active site mutants of pig citrate synthase: effects of mutations on the enzyme catalytic and structural properties. Biochemistry. 1996;35:10661–10672. - PubMed

Publication types

MeSH terms