. 2009 Oct 15;334(2):355-68.
doi: 10.1016/j.ydbio.2009.07.035. Epub 2009 Jul 29.

Drosophila cortex and neuropile glia influence secondary axon tract growth, pathfinding, and fasciculation in the developing larval brain

Affiliations

Drosophila cortex and neuropile glia influence secondary axon tract growth, pathfinding, and fasciculation in the developing larval brain

Shana R Spindler et al. Dev Biol. .

Abstract

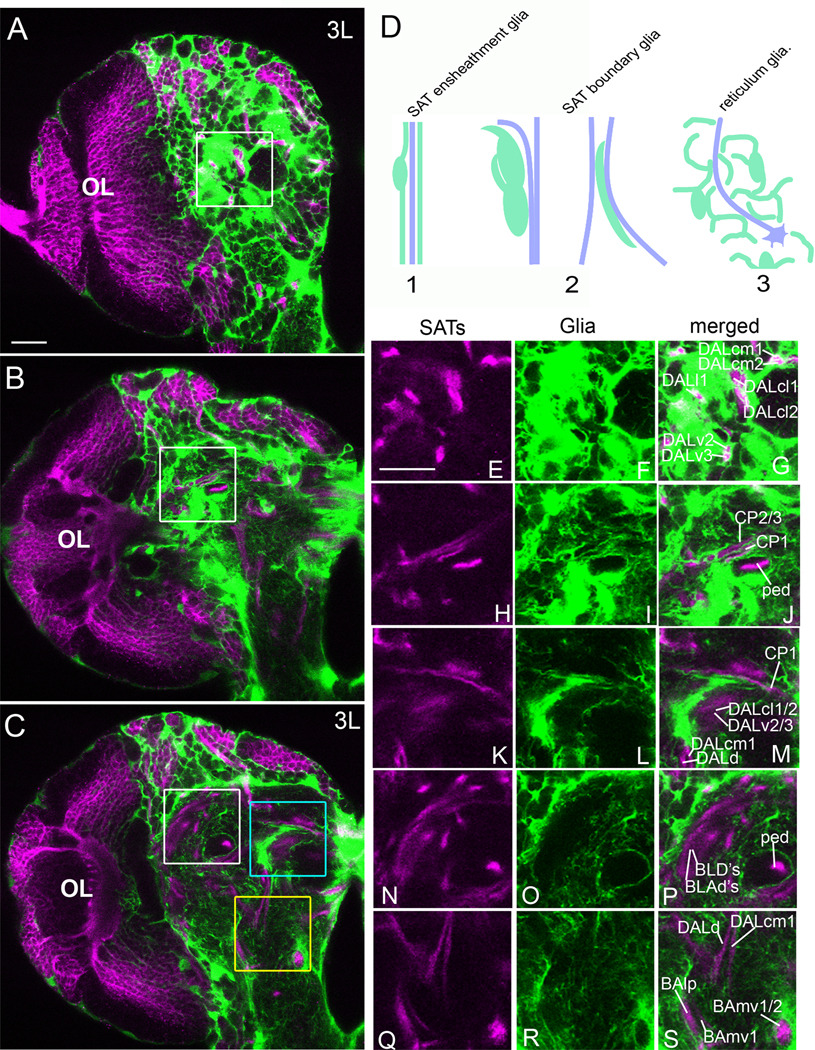
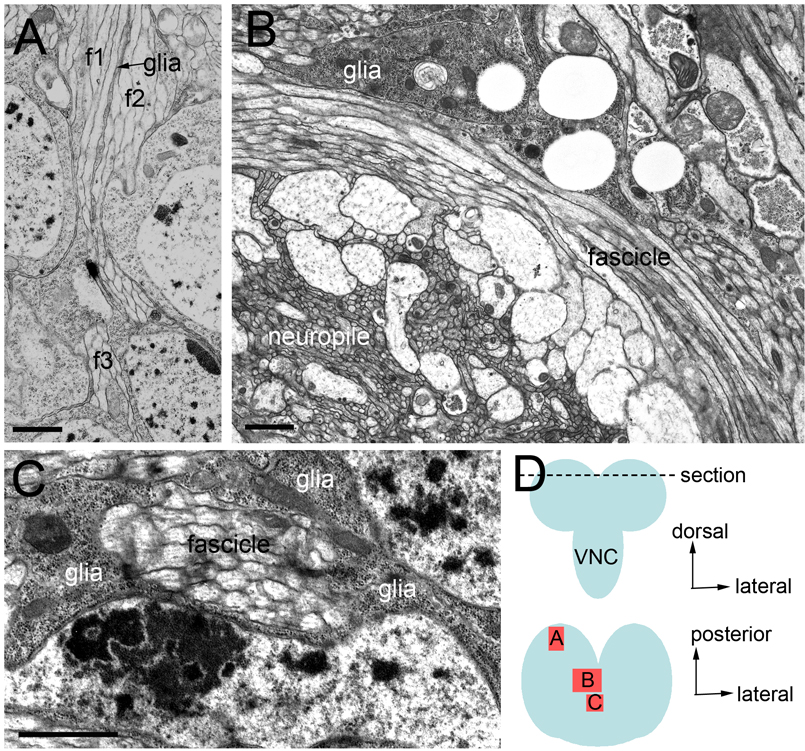
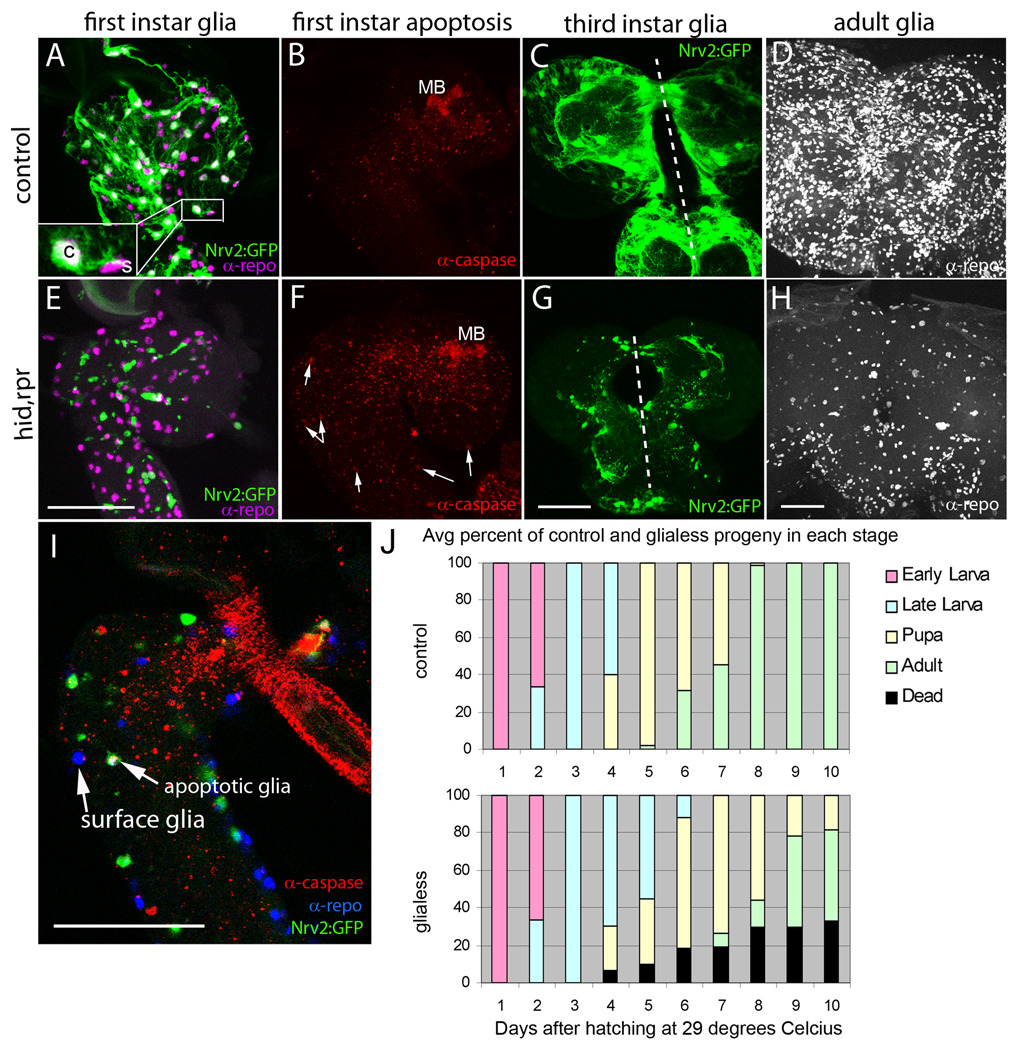
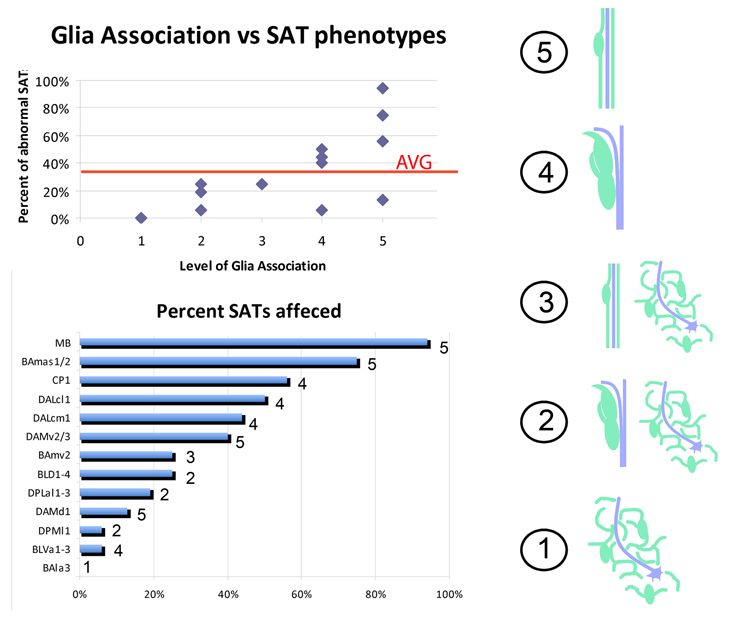
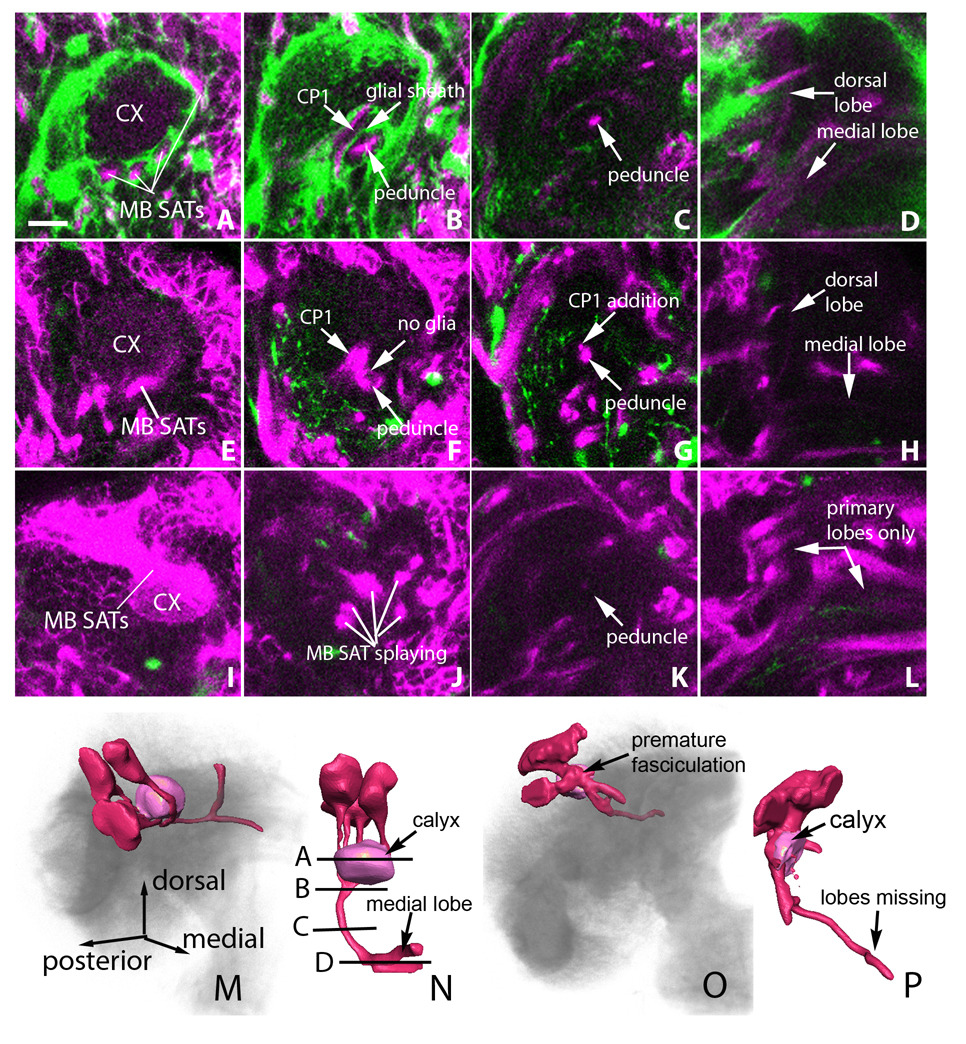
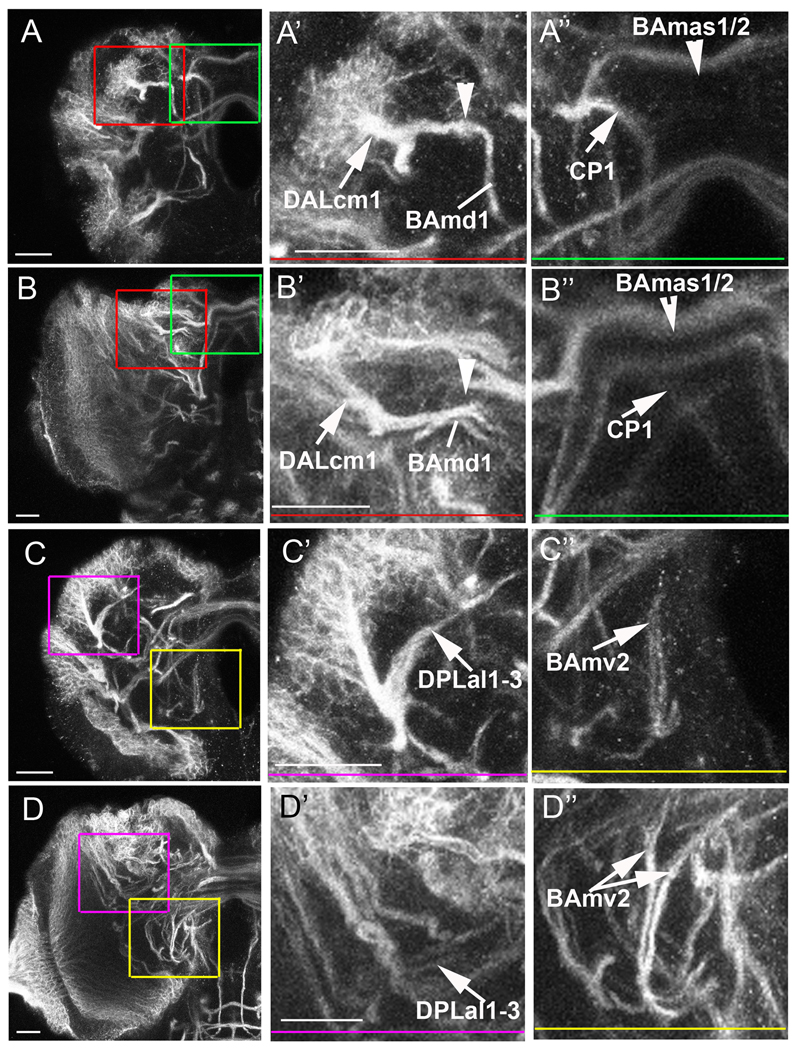
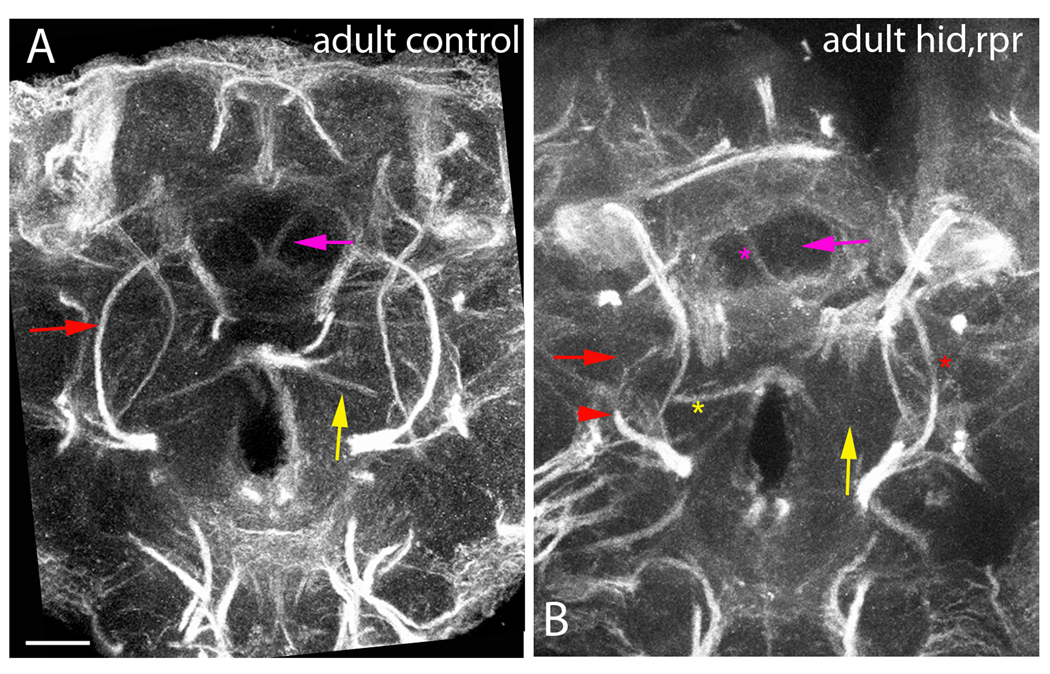
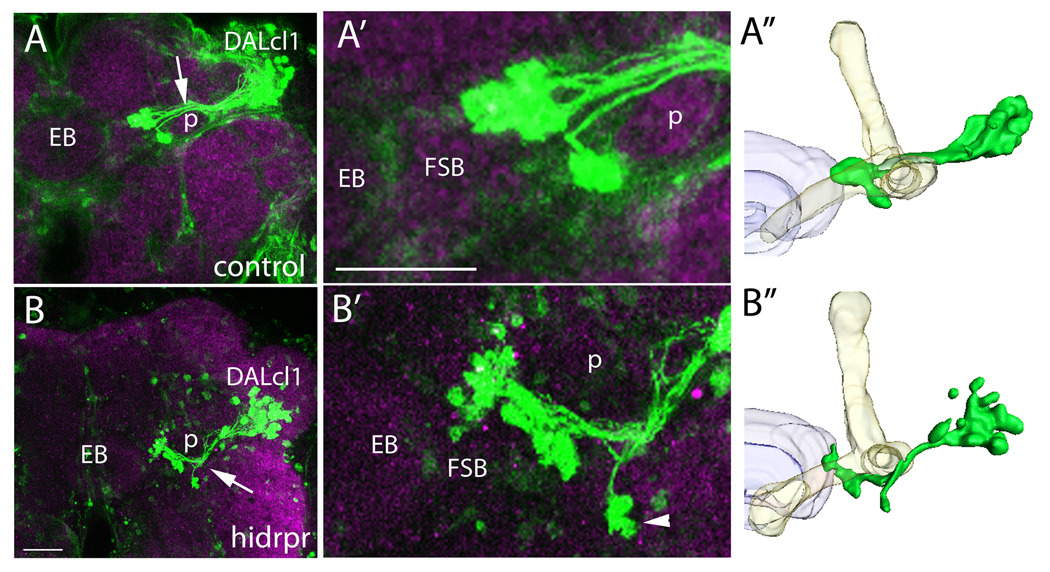
Glial cells play important roles in the developing brain during axon fasciculation, growth cone guidance, and neuron survival. In the Drosophila brain, three main classes of glia have been identified including surface, cortex, and neuropile glia. While surface glia ensheaths the brain and is involved in the formation of the blood-brain-barrier and the control of neuroblast proliferation, the range of functions for cortex and neuropile glia is less well understood. In this study, we use the nirvana2-GAL4 driver to visualize the association of cortex and neuropile glia with axon tracts formed by different brain lineages and selectively eliminate these glial populations via induced apoptosis. The larval central brain consists of approximately 100 lineages. Each lineage forms a cohesive axon bundle, the secondary axon tract (SAT). While entering and traversing the brain neuropile, SATs interact in a characteristic way with glial cells. Some SATs are completely invested with glial processes; others show no particular association with glia, and most fall somewhere in between these extremes. Our results demonstrate that the elimination of glia results in abnormalities in SAT fasciculation and trajectory. The most prevalent phenotype is truncation or misguidance of axon tracts, or abnormal fasciculation of tracts that normally form separate pathways. Importantly, the degree of glial association with a given lineage is positively correlated with the severity of the phenotype resulting from glial ablation. Previous studies have focused on the embryonic nerve cord or adult-specific compartments to establish the role of glia. Our study provides, for the first time, an analysis of glial function in the brain during axon formation and growth in larval development.


Figures

Figure 1
Figure 1. SAT-based pattern of cortex and neuropile glia
(A–C) Confocal sections (2µm thickness) of a nrv2-GAL4,UAS-GFP third instar brain stained with anti-Neurotactin (magenta). (A) Tangential section of the anterior cortex (medial to the right and dorsal to the top). The area defined by the white square is magnified to show complete wrapping of the DAL SATs in the cortex (E–G). (B) Cross section at the level of the anterior peduncle. The area defined by the white square is magnified to show complete wrapping of the peduncle (ped) and separation of the CP SATs by a glial sheath (H–J). (C) Posterior section at the level of the posterior peduncle. The area defined by the blue square is enlarged to show the CP1 SAT along a thin glial process and a thick glial border on the dorsal side of the DALcl and DALv tracts (K–L). The area defined by the white square is enlarged to show the posterior peduncle (ped), and the dorsal glia border along the BLD and BLAd SATs with little glia between the tracts (N–P). The area defined by the yellow square is enlarged to show complete wrapping of the proximal BAmv1/2 SATs, a glial border along the BAlp SAT, and the terminal DALd and DALcm1 SATs in the neuropile glial reticulum (Q–S). (B) Cartoon depicting types of glia-SAT interaction (glia are drawn in green, axons are denoted by purple lines). Type 1 interactions include complete wrapping of the SAT. The type 2 cartoon depicts SAT contact by condensation (“track”) of glial processes. Type 3 interactions are the most prevalent and include no obvious glial condensation around the SAT. Scale bars: 20 µm.
Figure 2
Figure 2. Electron micrographs of third instar brain illustrating the relationship between glia and SATs
In all sections, glia is distinguished from neuronal processes by a combination of the following: an increased electron density, a lack of organized microtubule bundles, irregular diameters, or the presence of sheath like processes. (A) Section through larval cortex showing a thin glial process separating adjacent axon fascicles (f1–3). (B) Section through a midline portion of the larval brain showing an association of glia with a bend in the axon fascicle as it enters the midline. (C) Transverse section through an axon fascicle at the larval midline highlighting complete wrapping by neuropile glia. (D) cartoon depicting approximate level of EM sections (top, anterior-posterior view) and areas imaged within the section (bottom, dorsal view). VNC ventral nerve cord. Scale bars: 1µm.
Figure 3
Figure 3. Inducing glia apoptosis
(A–D) profile of normal glia development from larval to adult stages compared to (E–H) a profile of induced glia apoptosis from larval to adult stages. (A,B) Lateral view of a nrv2-GAL4,UAS-GFP first instar brain and ventral nerve cord stained with anti-Repo (A, magenta) and anticleaved Caspase-3 (B, red) to label all glial nuclei and apoptotic cells, respectively. Only neuropile and cortex glia (c) express GFP while surface glia (s) remain GFP-negative (magnified inset). A sparse amount of apoptotic cells are visualized, with the exception of large amounts of apoptosis in the mushroom body. (E,F) Lateral view of a first instar brain and ventral nerve cord with nrv2-GAL4 driven expression of Hid and Rpr as well as GFP. Glia nuclei are labeled with anti-Repo (E, magenta) and apoptotic cells are labeled with anti-cleaved Caspase-3 (F, red). Note the decrease in GFP-positive cells while the nuclei of surface glia are still present (E) and the increase in apoptosis within the brain and nerve cord (F, arrows). In A,B,E,F dorsal is to the right and posterior is down. (I) lateral view of a first instar brain labeled with nrv2-GAL4>UAS-GFP (green), anti-Repo (blue), and anti-cleaved Caspase-3 (red). Note that the glia positive for both Caspase and Repo expresses GFP while the GFP-negative surface glia is Repo-positive but Caspase-negative. (C,G) anterior-posterior section (dorsal is up, and dotted line indicates the brain midline) of a third instar brain expressing only GFP (C) or Hid, Rpr, and GFP (G) in cortex and neuropile glia. Note the disorganized appearance of any remaining GFP-positive cells. (D,H) Anterior-posterior view of adult brains stained with anti-Repo. (D) twenty-micrometer section of the central portion of a wild-type adult brain compared to (H) the equivalent central portion of a brain expressing Hid and Rpr under nrv2-GAL4. Note the decrease in the number of Repo-positive cells by eclosion in brains expressing Hid and Rpr in cortex and neuropile glia. Remaining repo-positive cells around the periphery are the unaffected surface glia. (J) Growth profile of nrv2-GAL4>UAS-hid,rpr larva showing the percentage of progeny in each stage of development over the course of 10 days at 29 degrees Celsius. Scale bars: 50 µm.
Figure 4
Figure 4. Glia ranking correlates with SAT phenotypes upon glia elimination
(right) a numerical value is given to each type of SAT-glia interaction (glia are drawn in green, axons are denoted by a purple line). A ranking of 5 indicates the SAT is completely ensheathed by glia. 4 denotes glia bordering SAT tracts. 3 includes SATs that are first ensheathed but later have no apparent glial wrapping. 2 includes SATs that are first bordered but then show no stereotypical glial association. A ranking of 1 indicates that the SAT never has a stereotypical association with glia and instead entirely projects through the neuropile reticulum. (top) for all SATs analyzed, their glial ranking is plotted against the percentage of those SATs that exhibited an abnormal phenotype at third instar when cortex and neuropile glia were eliminated. The average number of SATs affected among all SATs is indicated by a red line. (bottom) graph indicating the percentage of SATs affected for each specific lineage with the given glial ranking shown to the right of each bar.
Figure 5
Figure 5. Glia elimination causes abnormal mushroom body fasciculation
Posterior to anterior sections of wild-type third instar mushroom bodies (A–D) are compared to mushroom bodies that develop in nrv2-GAL4>UAS-hid,rpr conditions (E–L). (A) posterior larval section showing glia labeled with GFP (green) and anti-Neurotactin (magenta) labeled SATs. Note glial separation of the four mushroom body SAT tracts as they wrap around the calyx (CX). (E,I) mushroom bodies that develop in the absence of glia show premature SAT bundling at the level of the calyx. (B) larval section at the point where the four mushroom body tracts merge. Note the thin glial process that separates the CP SATs from the peduncle. (F,J) larval sections in glia-less brains showing peduncle-CP tract merging (F) or mushroom body tract splaying (J) phenotypes. (C) In a more anterior section, the peduncle is seen as a single tract containing all four mushroom body lineage SATs. (G) An additional tract can be seen adjacent to the peduncle stemming form the CP-peduncle merge that occurred anteriorly. (K) After mushroom body splaying, the peduncle is seen as a very thin, faint tract in more anterior sections. (D, H) In the posterior brain, the mushroom body SATs split into a dorsal and medial lobe. (L) In the brain presenting mushroom body splaying, the dorsal and medial lobes are missing. Note that the negative space indicates the presence of a dorsal and medial lobe generated from the primary axon tracts which formed before glia elimination but are not labeled by anti-Neurotactin. (M,N) Three dimensional rendering of the mushroom body from panels A–D. (O,P) Three dimensional rendering of the mushroom body from panels I–L. In M and O, dorsal is up and medial is to the right. In N and P, posterior is up and dorsal is to the right. In all panels, sections are two micrometers thick. Scale bar: 10 µm.
Figure 6
Figure 6. Truncation and misguidance of SATs in the absence of glia
Ten-micrometer thick sections of glia-less (A,C) and wild-type (B,D) third instar brains stained with anti-Neurotactin. Enlargements of boxed areas are shown to the right with colored bars indicating area of enlargement. In each case, the wild-type projection is shown below the aberrant projections. (A,B) anterior section of a larval brain at the level of the category 5 DALcm1 (A’,B’), BAmas1/2 and CP1 (A”, B”) SATs. Note that the DALcm1 tract truncates early when it meets the dorsal projection of the BAmd1 lineage (A’, arrowhead). Normally, the DALcm1 SAT meets the BAmd1 SAT and continues to project medially (B’, arrowhead). The BAmas1/2 and CP1 SATs are compared in A” and B”. (A”) In the glia-less setting, the BAmas1/2 SAT only projects the more dorsal tract across the midline (A”, arrowhead), while the normal projection contains both a dorsal and ventral crossing (B”, arrowhead). The CP1 SAT projects in a curved trajectory down the medial portion of the ipsilateral hemisphere in the glia-less brain (A”, arrow). However, in normal conditions the CP1 tract diagonally crosses the midline into the contralateral hemisphere (B”, arrow). (C,D) Posterior section of the larval brain at the level of the DPLal1-3 lineages and the BAmv2 SAT terminal endings. (C’) The DPLal1-3 tracts project along the edge of the neuropile in glia-less brains (arrow). (D’) In control brains, the DPLal1-3 SATs enter the neuropile and make a U-shape dorso-medial turn (arrow). (C”) The terminal endings of the BAmv2 tract fail to separate upon glia elimination (arrow); whereas there is a clear BAmv2 SAT bifurcation in the control preparation (D”, double arrow). Scale bars: 20 µm.
Figure 7
Figure 7. Aberrant Projections in Adult SATs without glia
Central section of the adult brain stained with anti-Neuroglian at the level of the central-complex. Control adult brain (A) and nrv2-GAL4>UAS-hid,rpr adult brain (B) comparing differences in fascicle projections. In panel A, all arrows point to the stereotypical projections, while in panel B all arrows point to the missing tract. Pink arrows project to SATs that travel medially into the central portion of the ellipsoid body. Red arrows point to the axon fascicle generated by the BAmv1 lineage, and the red arrowhead indicates the truncated BAmv1 tract. Yellow arrows point to a ventrally located axon fascicle that originates in the lateral brain and projects towards the midline. In panel B, an asterisk indicates that the missing projection is still seen in the opposite hemisphere, indicating that we are in a comparable section to the control brain. Scale bar: 25 µm.
Figure 8
Figure 8. DALcl1 SAT projects toward the Fan-Shaped Body (FSB) along an aberrant path without glia
Confocal images of STAT92E10XGFP reporter expression (green) in the dorsal-lateral quadrant of adult brains stained with anti-DN-Cadherin to label the neuropile (magenta). (A,A’) STAT92E induced GFP expression is visualized in the DALcl1 lineage. The DALcl1 SAT projects dorsal to the peduncle (p, arrow) and terminates at the lateral edge of the fan-shaped body (FSB) in a cluster of small glomerular structures. (B,B’) Confocal image of a brain with nrv2-GAL4>UAS-hid,rpr showing STAT92E induced GFP expression in the DALcl1 lineage. In the glia-less setting, the tract projects ventral to the peduncle (arrow) towards the FSB, presenting ectopic terminal arbors in an abnormally lateral and ventral position (arrowhead). (A”,B”) Three-dimensional models showing the DALcl1/2 axon (green) in comparison to the mushroom body (yellow) and the central-complex (purple). Dorsal is up and medial is to the left in all images. EB ellipsoid body, FSB fan-shaped body, p peduncle. Scale bars: 25 µm.
Figure 9
Figure 9. Adult neuropile compartment disruption with glial loss
Confocal sections of the central-complex in adult brains stained with anti-DN-Cadherin (magenta) to label the neuropile compartments. The left column shows DN-Cadherin staining; the central column shows GFP expression (green) in cortex and neuropile glia, and the right column is the merged image. (A–C) Control nrv2-GAL4>UAS-GFP brain showing a fully closed, circular ellipsoid body (EB) and fan-shaped body (FSB) surrounded by thick glial sheathes. (D–F) Experimental nrv2-GAL4>UAShis,rpr brain exhibiting an open EB devoid of any circular structure (arrow) and a smaller, misshapen FSB. (G–I) Confocal sections from adult brains after incorporation of the tubGAL80 temperature sensitive (ts) transgene into the nrv2-GAL4>UAS-hid,rpr line followed by temperature shifting from 18 degrees Celsius to 29 degrees Celsius at wandering third instar. Note that the EB retains an ellipsoid shape and the FSB is no longer misshapen when glia are not eliminated until late third instar. Scale bar: 25 µm.

References

    1. Ashburner M. A Laboratory Handbook. Cold Spring Harbor Laboratory Press; 1989.
    1. Bach EA, Ekas LA, Ayala-Camargo A, Flaherty MS, Lee H, Perrimon N, Baeg GH. GFP reporters detect the activation of the Drosophila JAK/STAT pathway in vivo. Gene Expr Patterns. 2007;7:323–331. - PubMed
    1. Bainton RJ, Tsai LT, Schwabe T, DeSalvo M, Gaul U, Heberlein U. Moody encodes two GPCRs that regulate cocaine behaviors and blood-brain barrier permeability in Drosophila. Cell. 2005;123:145–156. - PubMed
    1. Bastiani MJ, Goodman CS. Guidance of neuronal growth cones in the grasshopper embryo. III. Recognition of specific glial pathways. J Neurosci. 1986;6:3542–3551. - PMC - PubMed
    1. Baumann PM, Oland LA, Tolbert LP. Glial cells stabilize axonal protoglomeruli in the developing olfactory lobe of the moth Manduca sexta. J Comp Neurol. 1996;373:118–128. - PubMed

Publication types

MeSH terms

Substances

LinkOut - more resources