. 2009 Dec;42(4):267-77.
doi: 10.1016/j.mcn.2009.07.011. Epub 2009 Jul 28.

Feedback regulation of NEUROG2 activity by MTGR1 is required for progression of neurogenesis

Affiliations

Feedback regulation of NEUROG2 activity by MTGR1 is required for progression of neurogenesis

Joshua D Aaker et al. Mol Cell Neurosci. 2009 Dec.

Abstract

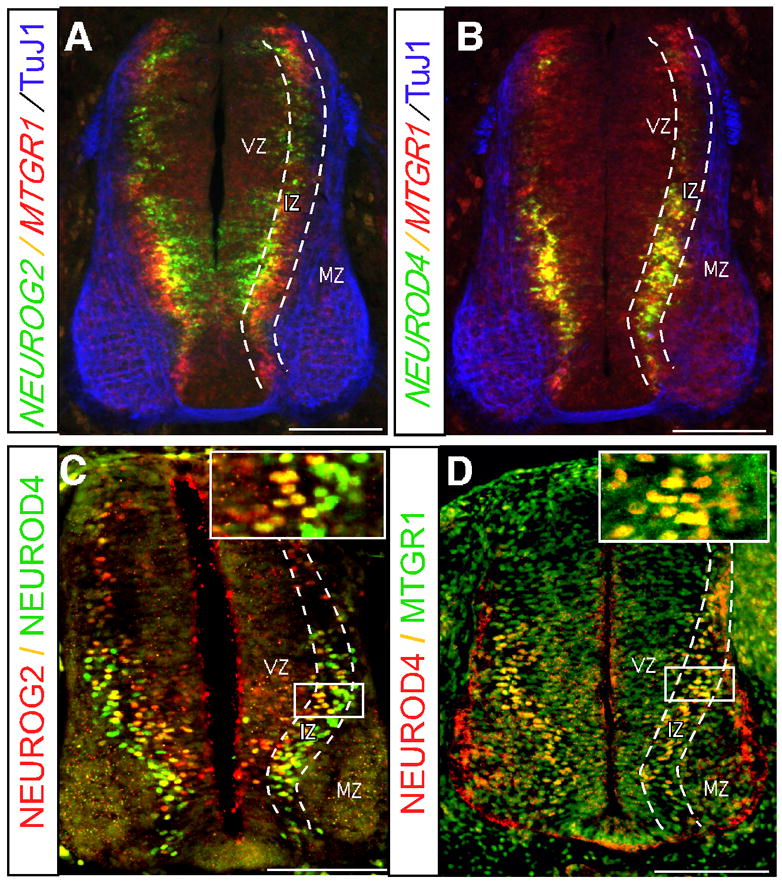
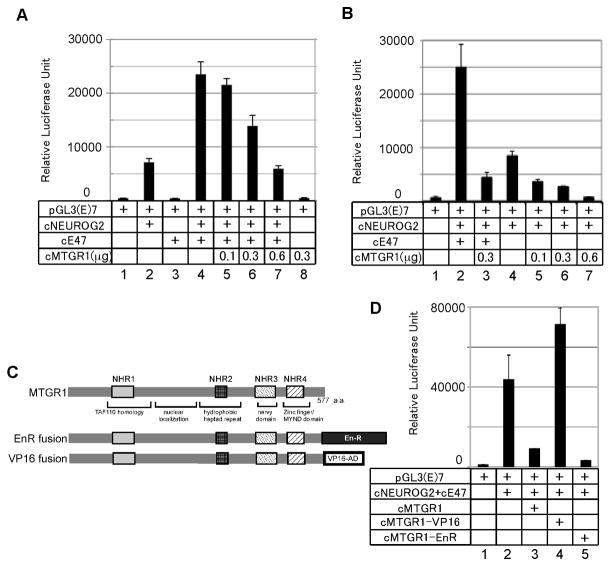
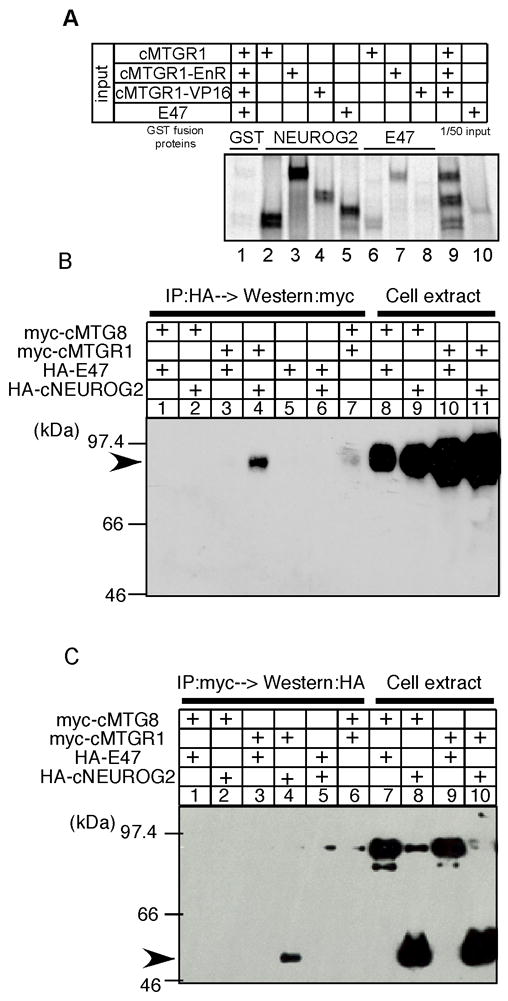
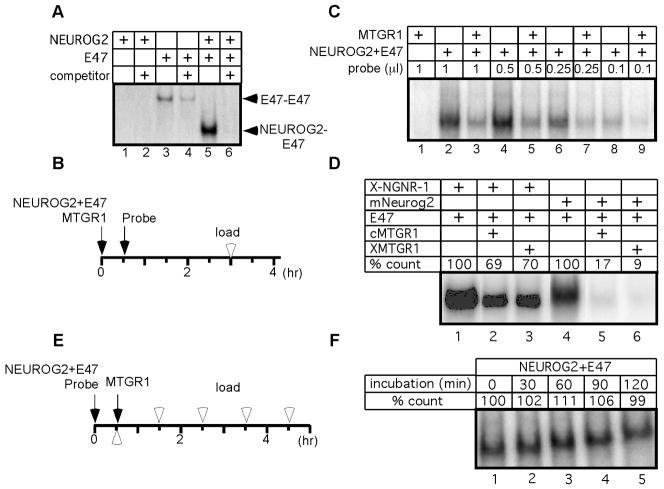
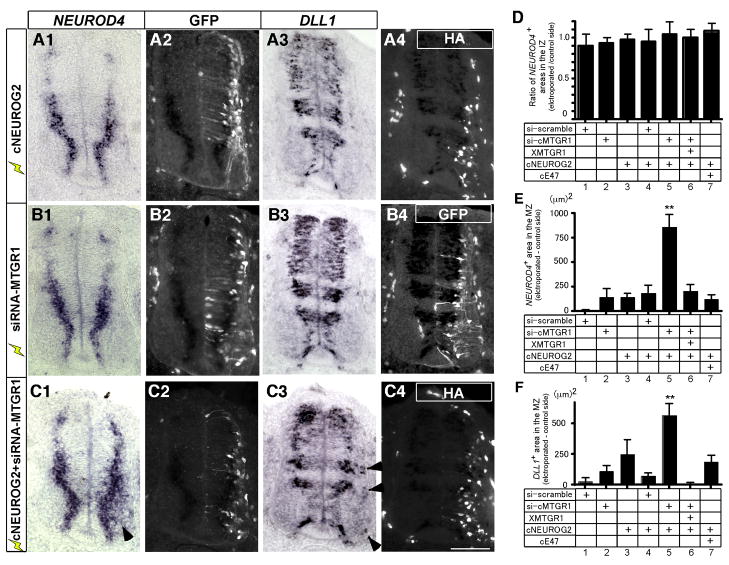
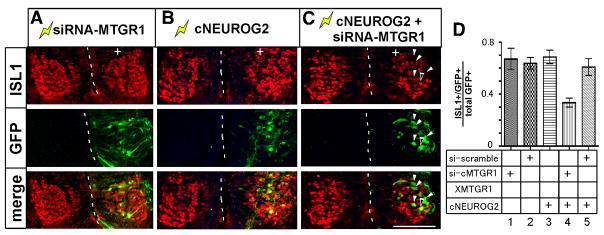
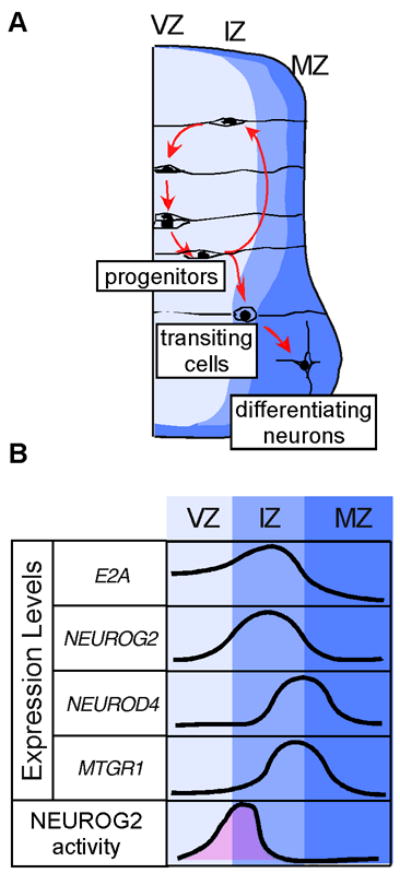
The sequential steps of neurogenesis are characterized by highly choreographed changes in transcription factor activity. In contrast to the well-studied mechanisms of transcription factor activation during neurogenesis, much less is understood regarding how such activity is terminated. We previously showed that MTGR1, a member of the MTG family of transcriptional repressors, is strongly induced by a proneural basic helix-loop-helix transcription factor, NEUROG2 in developing nervous system. In this study, we describe a novel feedback regulation of NEUROG2 activity by MTGR1. We show that MTGR1 physically interacts with NEUROG2 and represses transcriptional activity of NEUROG2. MTGR1 also prevents DNA binding of the NEUROG2/E47 complex. In addition, we provide evidence that proper termination of NEUROG2 activity by MTGR1 is necessary for normal progression of neurogenesis in the developing spinal cord. These results highlight the importance of feedback regulation of proneural gene activity in neurodevelopment.


Figures

Figure 1
Figure 1. Expression of NEUROG2, MTGR1, and NEUROD4 in the chick embryo spinal cord
Cross sections of embryos at HH stage 24 at the brachial level are shown. A, B: Fluorescent in situ hybridization of NEUROG2, NEUROD4 and MTGR1 combined with immunohistochemistry of TuJ1. C, D: Double immunohistochemistry of NEUROG2, NEUROD4 and MTGR1. Colors of the probes are indicated next to figures. Boundaries of the VZ, the IZ, and the MZ are indicated by dotted lines. Boxed areas are enlarged in the insets of C and D. Bars: 100 μm. Note that NEUROG2 is expressed most medially, closest to the ventricle, followed by MTGR1 and NEUROD4, appearing at the same medio-lateral position. Both genes are down-regulated in the MZ.
Figure 2
Figure 2. MTGR1 represses transcriptional activity of the NEUROG2-E47 complex
A, B, D: Transient transfection assay. C: Diagram of the fusion molecules of chick MTGR1. A, B: P19 cells were transfected with the indicated vectors and increasing amounts of the MTGR1 expression vector (0.1, 0.3 and 0.6 μg). MTGR1 repressed transcription activity of NEUROG2-E47 (A) or NEUROG2 alone (B) dose dependently. Total amount of DNA transfected per sample was adjusted with an empty vector. D: Transcription activity of MTGR1 fusion proteins. P19 cells were transfected with the indicated vectors and 0.3μg of vectors encoding MTGR1 fusion molecules. Bars show SD for all paels. Essentially the same results were obtained from P19 and HEK293T cells for all assays, and the results from P19 cells are shown.
Figure 3
Figure 3. MTGR1 directly interacts with NEUROG2
A: GST pull-down assay. Radiolabeled MTG proteins or E47 were pulled down with glutathione sepharose beads coated with GST molecule alone (lane 1), GST-NEUROG2 fusion (lanes 2–5) or GST-E47 fusion molecules (lanes 6–8). Lanes 9–10 contain 1/50 of input proteins. B, C: Immunoprecipitation assays. HEK293T cells were transfected with expression vectors of the indicated proteins. Cell lysates were immunoprecipitated with antibodies against the HA (B) or the myc epitopes (C), and recovered proteins were analyzed by Western blot using anti-myc (B) or anti-HA (C) antibodies. Whole cell extracts were analyzed in lanes 8–11 of B and lanes 7–10 of C to confirm protein expression.
Figure 4
Figure 4. MTGR1 blocks DNA binding activity of the NEUROG2-E47 complex
A: EMSA of NEUROG2 and E47, either synthesized individually (lanes 1–4) or in the same reaction (lanes 5–6). Twenty-fold excess of cold competitor was added to test the specificity (lanes 2, 4, 6). Arrowheads point to bands containing E47 homodimer (E47-E47) and NEUROG2-E47 heterodimer (NEUROG2-E47). B, E: Experimental schedule testing the effect of MTGR1 on association (B) and dissociation (E) of NEUROG2-E47 complex to/from DNA, respectively. Black arrows and white arrowheads indicate the times when proteins and probes were mixed and loaded on a gel, respectively. C: EMSA was carried out using schedule shown in B with varying amounts of probes. D: Various MTG molecules were examined following the schedule shown in B. Intensity of each band was quantified on a phosphorimager and shown as percentage of the band without MTGR1. F: EMSA was done as diagrammed in E. Relative radioactivity compared to lane 1 is shown. Since samples were applied every 30 min on a continuously running gel, migration distances appear different from each other.
Figure 5
Figure 5. NEUROG2 activity is inhibited by MTGR1 in vivo
A–C: Chick spinal cord was electroporated with expression vectors of HA-tagged cNEUROG2 (A1–4), siRNA-MTGR1 (B1–4) or combination of both (C1–4) at E2 and harvested at E4. The siRNA-MTGR1 vector has a GFP gene that allows identification of the electroporated cells. For A1–4, an expression vector for GFP was co-electroporated as a tracer. Sections at the brachial level were analyzed for NEUROD4 expression by in situ hybridization (A1, B1, C1), anti-GFP immunohistochemistry (A2, B2, B4, C2), DLL1 in situ hybridization (A3, B3, C3), and immunohistochemistry against the HA tag (A4, C4). The left two and the right two pictures of each line are from the same section, and the two pairs of pictures are from the neighboring sections. In situ hybridization signal is visible in the immunofluorescent channels as dark areas due to absorption of light by color pigments. The electroporated sides are oriented to the right in all figures. Arrowheads in C1 and C3 point to ectopically expressed NEUROD4 and DLL1 in the MZ. Scale bar: 100 μm. D–F: Quantification of the areas expressing NEUROD4 in the IZ (D), NEUROD in the MZ (E) and DLL1 in the MZ (F). D. Pixels of NEUROD4 positive areas within the IZ were counted and the ratios of electroporated and un-electroporated sides were calculated. E, F. Pixels of positive areas for each marker in the MZ was quantified and the difference between electroporated and control sides is shown. Error bars: SEM.
Figure 6
Figure 6. Cells with elevated NEUROG2 activity in the MZ show impaired neurogenesis
A–C: Electroporated embryos were analyzed for expression of ISL1 (red) and GFP (green). Electroporated sides are oriented to the right and indicated by (+). The midlines of the spinal cord are demarcated by dotted lines. White arrowheads in C point to GFP positive, ISL1 negative cells. Black arrowhead points to a double positive cell. Bar: 100 μm. D: Quantification of the ratio of cells co-labeled with ISL1 and GFP. GFP positive cells within the postmitotic motorneuron domain were counted. Each bar represents average of 10–15 sections. Error bars: SEM.
Figure 7
Figure 7. Model: NEUROG2 activity is limited to a narrower area compared to its expression domain by the function of MTGR1
A: Diagram of cell movement during neurogenesis. Progenitors are located in the VZ. After the last mitosis, committed neuronal progenitors migrate to the IZ, and delaminate to the MZ. Note that similar gene expression pattern is observed in development of the mouse central nervous system (Alishahi et al., 2009). B: Relative expression levels of genes studied in this paper. The area shaded in pink represents conceptual transcriptional activity of NEUROG2 based on our findings. Note that the activity of NEUROG2 is limited to narrower window of time compared to the period of its gene expression.

References

    1. Alishahi A, Koyano-Nakagawa N, Nakagawa Y. Regional expresion of MTG genes in the developing mouse central nervous system. Dev Biol. 2009 In press. - PMC - PubMed
    1. Amann JM, Chyla BJI, Ellis TC, Martinez A, Moore AC, Franklin JL, McGhee L, Meyers S, Ohm JE, Luce KS, Ouelette AJ, Washington MK, Thompson MA, King D, Gautam S, Coffey RJ, Whitehead RH, Hiebert SW. Mtgr1 is a transcriptional corepressor that is required for maintenance of the secretory cell lineage in the small intestine. Molecular and Cellular Biology. 2005;25:9576–9585. - PMC - PubMed
    1. Ausubel FM, editor. Current protocols in molecular biology. John Wiley & Sons, Inc; 1994.
    1. Bergsland M, Werme M, Malewicz M, Perlmann T, Muhr J. The establishment of neuronal properties is controlled by Sox4 and Sox11. Gene Dev. 2006;20:3475–3486. - PMC - PubMed
    1. Cai L, Morrow EM, Cepko CL. Misexpression of basic helix-loop-helix genes in the murine cerebral cortex affects cell fate choices and neuronal survival. Development. 2000;127:3021–3030. - PubMed

Publication types

MeSH terms

Substances