. 2009 Aug 7;138(3):476-88.
doi: 10.1016/j.cell.2009.05.036. Epub 2009 Jul 30.

Identification of a physiologically relevant endogenous ligand for PPARalpha in liver

Affiliations

Identification of a physiologically relevant endogenous ligand for PPARalpha in liver

Manu V Chakravarthy et al. Cell. .

Abstract

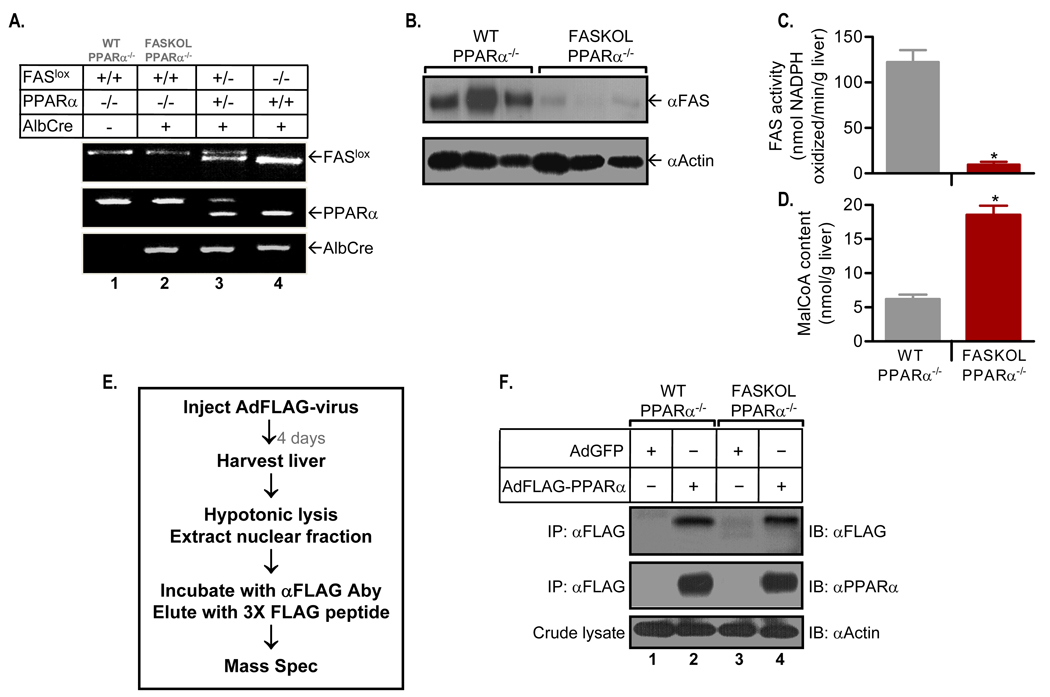
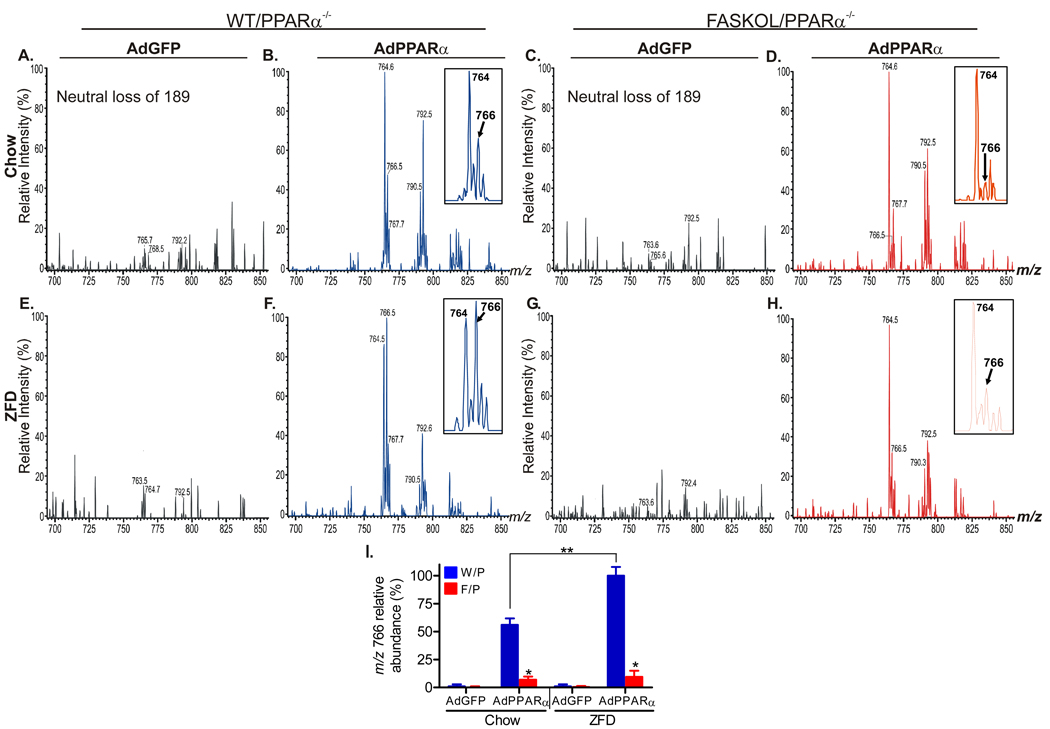
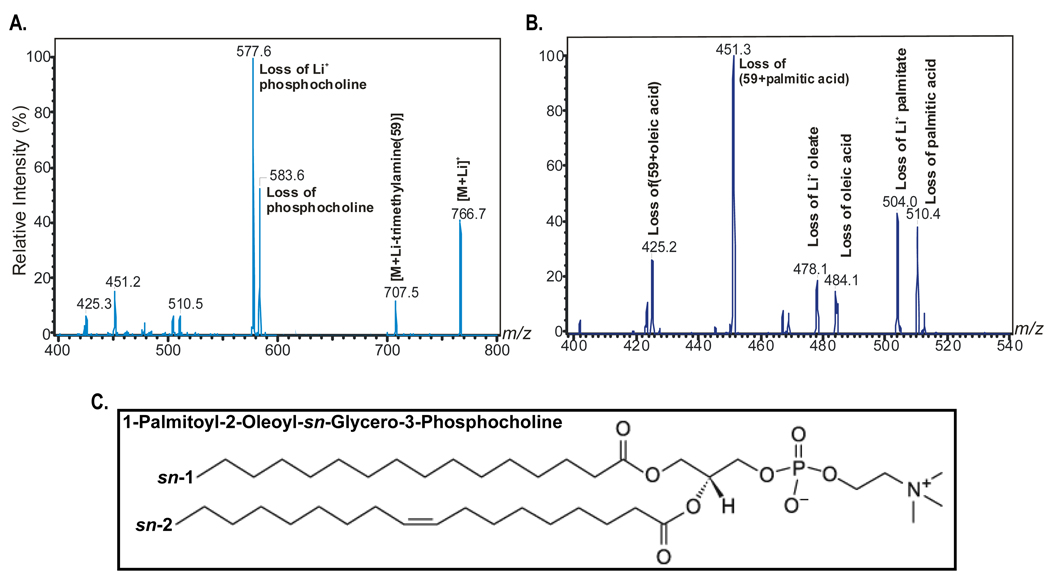
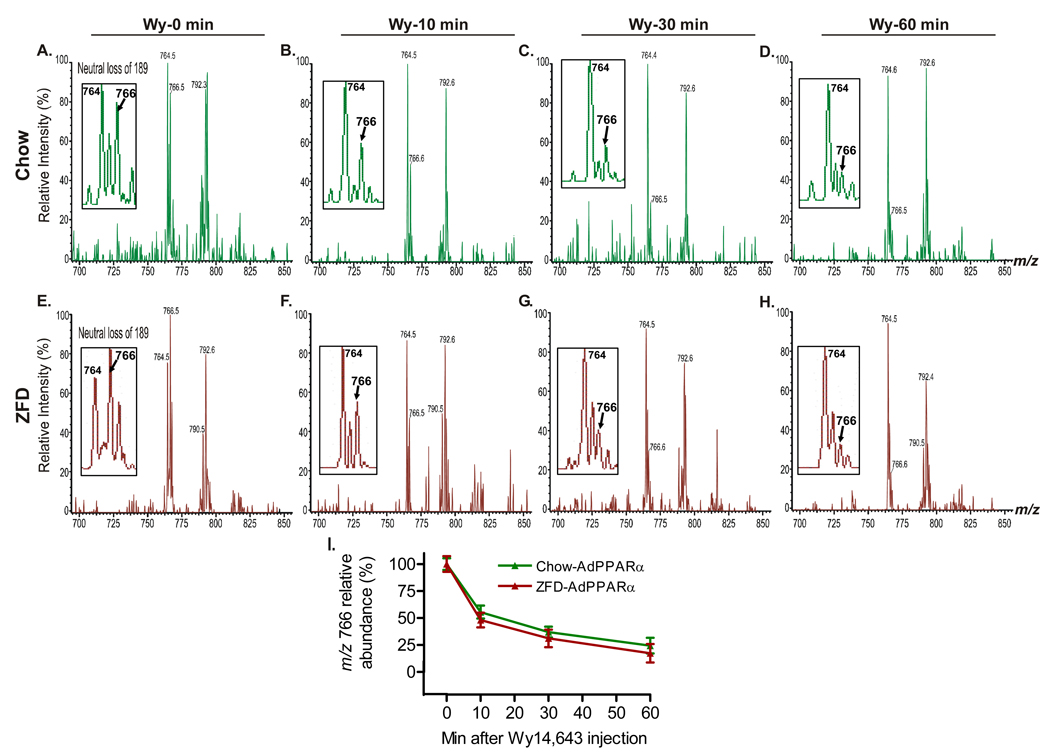
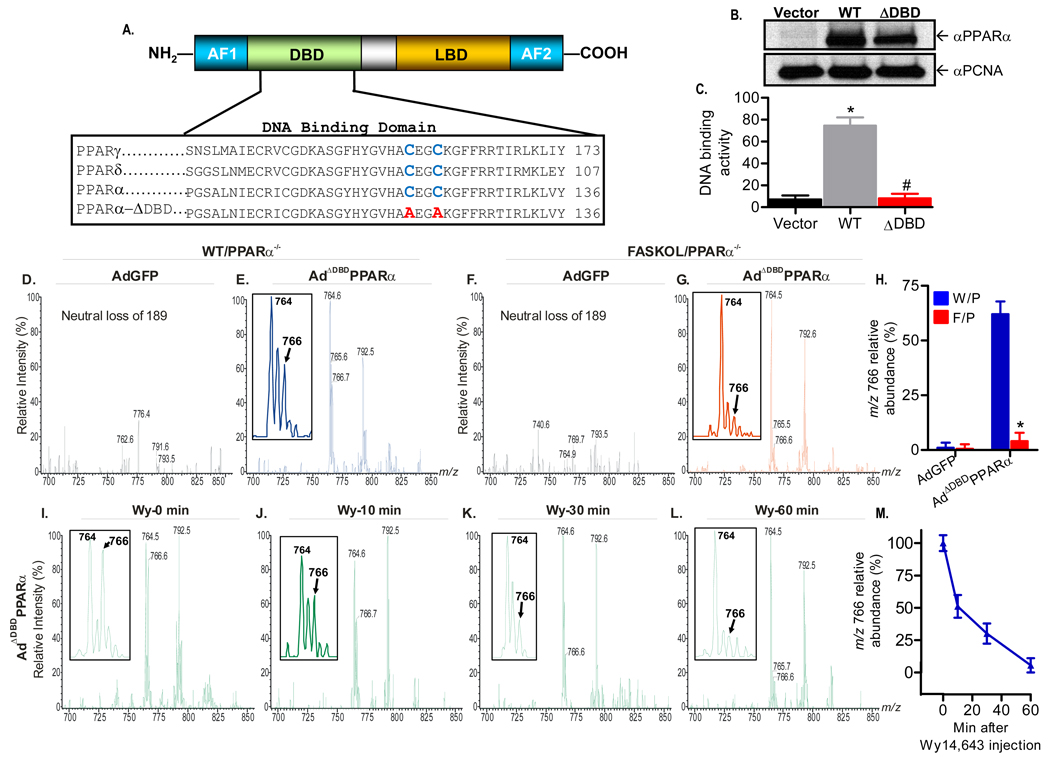
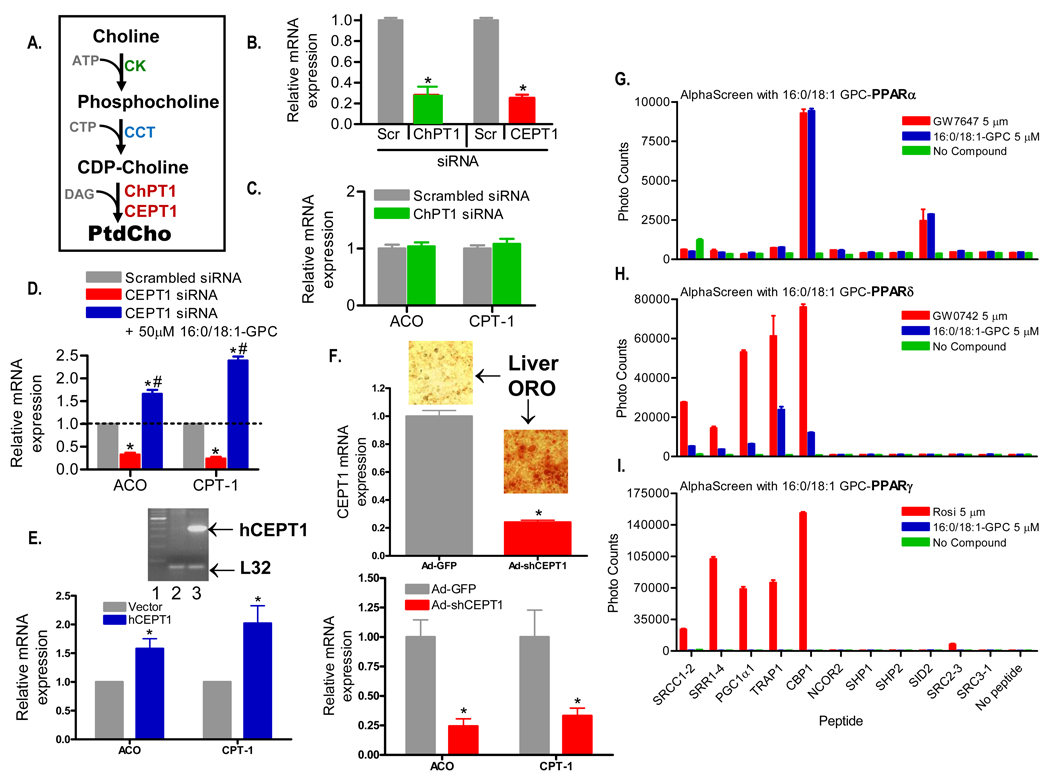
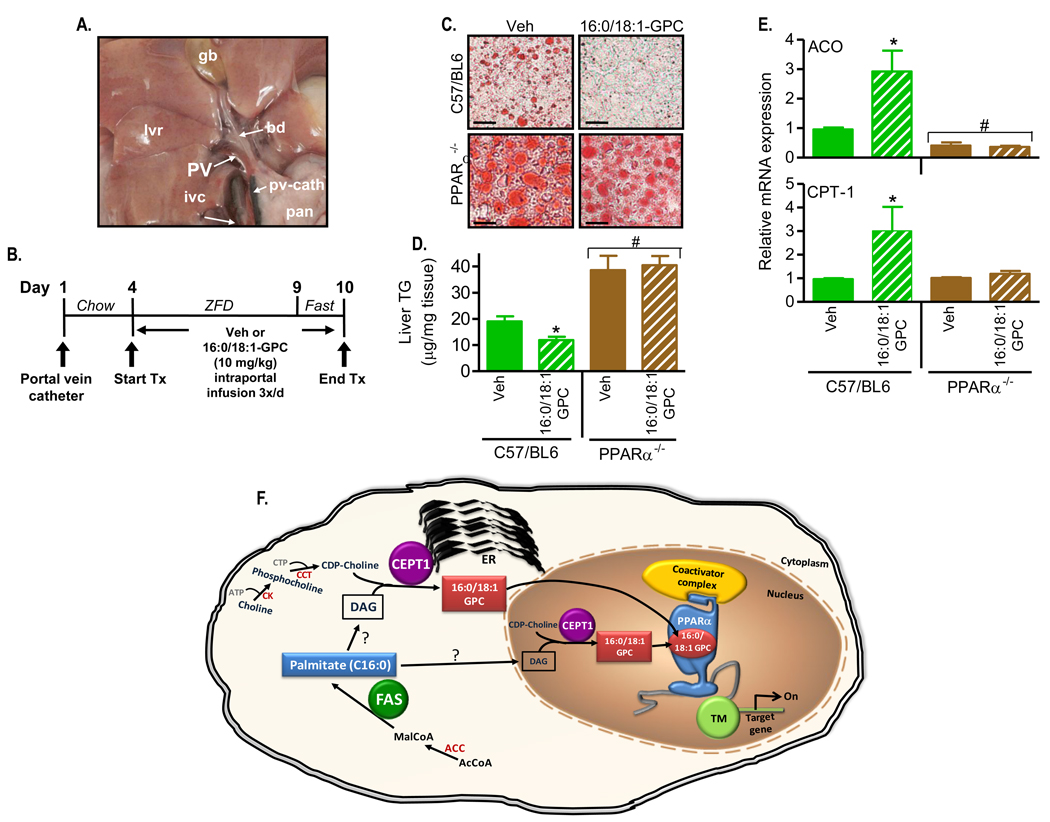
The nuclear receptor PPARalpha is activated by drugs to treat human disorders of lipid metabolism. Its endogenous ligand is unknown. PPARalpha-dependent gene expression is impaired with inactivation of fatty acid synthase (FAS), suggesting that FAS is involved in generation of a PPARalpha ligand. Here we demonstrate the FAS-dependent presence of a phospholipid bound to PPARalpha isolated from mouse liver. Binding was increased under conditions that induce FAS activity and displaced by systemic injection of a PPARalpha agonist. Mass spectrometry identified the species as 1-palmitoyl-2-oleoyl-sn-glycerol-3-phosphocholine (16:0/18:1-GPC). Knockdown of Cept1, required for phosphatidylcholine synthesis, suppressed PPARalpha-dependent gene expression. Interaction of 16:0/18:1-GPC with the PPARalpha ligand-binding domain and coactivator peptide motifs was comparable to PPARalpha agonists, but interactions with PPARdelta were weak and none were detected with PPARgamma. Portal vein infusion of 16:0/18:1-GPC induced PPARalpha-dependent gene expression and decreased hepatic steatosis. These data suggest that 16:0/18:1-GPC is a physiologically relevant endogenous PPARalpha ligand.


Figures

Figure 1
Figure 1. Generation of Liver-specific FAS knockout (FASKOL) Mice on a PPARα null Background and Reconstitution of Liver PPARα Expression
(A) PCR analysis. Liver DNA was amplified using primer sets for the FAS floxed allele (top panel), PPARα (middle panel), and Cre (bottom panel). (B) Immunoblot analysis of liver lysates for wild type (WT) and FASKOL mice on a PPARα null background using FAS (top panel) and actin (bottom panel) antibodies. (C and D) FAS activity (C) and malonyl-CoA content (D). Liver homogenates from overnight-fasted 12 h chow-refed male WT and FASKOL mice on a PPARα null background were assayed. Each bar represents mean ± SEM of 6–8 mice of each genotype. *, P < 0.05. (E) Diagram for isolation of FLAG-tagged PPARα. (F) Immunoprecipitation (IP) and immunoblot (IB) analysis in livers of WT and FASKOL mice on a PPARα null background infected with adenoviruses encoding GFP alone (AdGFP) or FLAG-tagged PPARα (AdFLAG-PPARα). Nuclear fractions were immunoprecipitated with anti-FLAG antibodies and immunoblotted with either anti-FLAG antibody (top panel) or anti-PPARα antibody (middle panel). Crude liver lysates were immunoblotted with anti-actin antibody (bottom panel). Blots are representative of >12 independent experiments.
Figure 2
Figure 2. Identification of a Glycerophosphocholine (GPC) Species in FLAG-eluted Hepatic Nuclear Extracts
Positive ion ESI/MS analyses of lithiated adducts of hepatic nuclear phospholipids were performed to monitor neutral loss of 189 [LiPO4(CH2)2N(CH3)3], which identifies parent [MLi+ ]ions that contain the phosphocholine head-group in lipid mixtures. (A–D) Representative profiles of GPC species in chow fed WT and FASKOL mice on a PPARα null background infected with AdGFP (A and C) or AdFLAG-PPARα (B and D). (E–H) Representative profiles of GPC species in zero fat diet (ZFD) fed WT and FASKOL mice on a PPARα null background infected with AdGFP (E and G) or AdFLAG-PPARα (F and H). Insets in B, D, F, and H depict the fragment ion at mass-to-charge ratio (m/z) 766 as the specific GPC species that is both PPARα and FAS dependent. (I) Quantification of the relative abundance of the m/z 766 ion with respect to genotype (W/P, WT on PPARα null−/− background; F/P, FASKOL on PPARα null−/− background) and diet (chow and ZFD). Each bar represents mean ± SEM from 3 independent experiments with 4–6 mice in each group per experiment. *, P < 0.05 vs. corresponding W/P control; **, P < 0.05.
Figure 3
Figure 3. Tandem Mass Spectrometry Identifies the GPC species as 1-palmitoyl-2-oleoly-sn-glycerol-3-phosphocholine (16:0/18:1-GPC)
(A) Fragmentation pattern upon collisionally-activated dissociation of the ion of m/z 766, which corresponds to the lithiated adduct [MLi+] of 16:0/18:1-GPC. (B) Expansion of the mass spectrum in A from m/z 400 to m/z 540 to illustrate relative abundances of ions that represent losses of fatty acid substitutents. The data indicate that palmitate and oleate are the sn-1 and sn-2 substituents, respectively. (C) Structure of the putative PPARα ligand.
Figure 4
Figure 4. In vivo Displacement of the Endogenous PPARα Ligand with a PPARα Agonist Li+ adducts of GPC molecular species in excess FLAG-eluted hepatic nuclear extracts obtained from Wy14,643 (Wy)-treated mice were analyzed by positive ion ESI/MS/MS scans monitoring neutral loss of 189, which reflects elimination of lithiated phosphocholine from the parent [MLi+] ion
(A–D) Representative ESI/MS/MS scans of GPC species at baseline (time 0) (A), 10 min (B), 30 min (C) and 60 min (D) after an intraperitoneal injection of 50 µg/g Wy14,643 in chow fed WT mice on a PPARα null background injected with AdFLAG-PPARα adenovirus. (E–H) Representative ESI/MS/MS scans of GPC species at baseline (time 0) (E), 10 min (F), 30 min (G) and 60 min (H) following the same treatment in ZFD fed mice. Insets in A–H depict the ion at m/z 766 (16:0/18:1-GPC) that is displaced in a time-dependent manner by Wy14,643. (I) Quantification of the relative abundance of the m/z 766 ion in response to Wy14,643. Graphs represent mean ± SEM from two independent experiments with 4–5 mice in each group per experiment.
Figure 5
Figure 5. Generation of a PPARα DNA Binding Domain (DBD) Mutant Adenovirus and Mass Spectrometric Analysis
(A) Schematic of the modular domain structure of PPARα (top panel). AF, activating function; LBD, ligand binding domain. The two highly conserved cysteine residues (blue) within the DBD of the PPAR family (bottom panel) were mutated to alanine (red). (B) Immunoblot analysis of Cos-7 cells transfected with empty vector, wild type (WT), or DBD-mutant (ADBD) PPARα plasmids using anti-PPARα and proliferating cell nuclear antigen (PCNA) antibodies. Gels are representative of three independent experiments. (C) Mutation C119A, C122A disrupts PPARα DNA binding activity. Cos-7 cells were transfected and DNA binding activity was assayed. Graphs represent mean ± SEM of experiments performed in triplicate. *, P < 0.05 vs. empty vector. #, P < 0.05 vs. WT control. (D–G) Representative positive ion ESI/MS/MS scans monitoring neural loss of 189 from lithiated adducts of GPC species in FLAG-eluted hepatic nuclear extracts obtained from chow fed WT and FASKOL mice on a PPARα null background infected with AdGFP (D and F) or AdΔDBDPPARα (E and G) adenoviruses. Insets in E and G indicate that the material represented by the ion at m/z 766 is the FAS-dependent phospholipid molecular species. A tandem spectrum of this ion (Figure 3) establishes its identity as [MLi+] of 16:0/18:1-GPC (H) Quantification of the relative abundance of the m/z 766 ion in response to control and mutant adenoviral injections in W/P (WT on PPARα null background) and F/P (FASKOL on PPARα null background) mice. Each bar represents the mean ± SEM from three independent experiments with 4–6 mice in each group per experiment. *, P < 0.05 vs. corresponding W/P control. (I–L) Representative neutral loss of 189 ESI/MS/MS scans of GPC species at baseline (time 0) (I), 10 min (J), 30 min (K) and 60 min (L) following intraperitoneal injection of 50 µg/g Wy14,643 in chow fed WT mice on a PPARα null−/− background injected with AdΔDBDPPARα adenovirus. Insets in I–L indicate that the ion at m/z 766 (16:0/18:1-GPC) is displaced from the DBD defective PPARα in a time-dependent manner by Wy14,643. (M) Quantification of the relative abundance of the m/z 766 ion in response to Wy14,643 administration in WT mice on a PPARα null background injected with AdΔDBDPPARα adenovirus. Graphs represent mean ± SEM from two separate experiments with 3–4 mice in each group per experiment.
Figure 6
Figure 6. Gene Expression and Binding Assays
(A) Schematic of the Kennedy pathway to generate phosphatidylcholine (PtdCho). CK, choline kinase; CTP, cytosine triphosphate; CCT, CTP phosphocholine citidyltransferase; DAG, diacyl glycerol; ChPT1, choline phosphotransferase 1; CEPT1, choline-ethanolamine phosphotransferase 1. (B) Effect on ChPT1 and CEPT1 mRNA levels normalized to L32 ribosomal mRNA in response to 72 h treatment with corresponding siRNAs and scrambled (Scr) controls in Hepa 1–6 cells. (C) Effect of 72 h treatment with scrambled and ChPT1 siRNAs on PPARα target genes (ACO and CPT-1) by RT-PCR normalized to L32 ribosomal mRNA in Hepa 1–6 cells. (D) Effect of 72 h treatment with scrambled and CEPT1 siRNAs on ACO and CPT-1 message levels in Hepa 1–6 cells. Expression of ACO and CPT-1 was also assessed 24 h after addition of 50 µM 16:0/18:1-GPC in a subset of Hepa 1–6 cells previously treated with CEPT1 siRNA. mRNA levels are normalized to control L32 ribosomal mRNA. For C–E, graphs represent mean ± SEM of three separate experiments with each group in triplicate. *, P < 0.05 compared to scrambled controls. #, P < 0.05 compared to CEPT1 siRNA treated cells. (E) Effect of CEPT1 overexpression on ACO and CPT-1 message levels in Hepa 1–6 cells. Cells were transfected with a human CEPT1 expression vector, and expression was documented by the RT-PCR reaction shown in the inset (lane 1-ladder, lane 2-cells transfected with empty vector, lane 3-cells transfected with the human CEPT1 vector). Graphical results are normalized to L32 mRNA. *, P < 0.05 compared to vector. (F) Effect of CEPT1 knockdown in living mice. C57BL/6 mice were treated with an shRNA adenovirus for CEPT1 or a control virus expressing GFP. shRNA treatment resulted in decreased expression of CEPT1 (top panel) and livers showed increased staining by Oil Red O (ORO). shRNA-treated livers also showed decreased expression of ACO and CPT-1 (bottom panel). Results are normalized to L32. *, P < 0.05 compared to GFP treatment. (G–I) Binding of various peptide motifs to the purified PPARα (G), PPARδ (H), and PPARγ (I) LBD in the presence of 5 µM of the corresponding PPAR agonist or 16:0/18:1-GPC as measured by AlphaScreen assays. The background signals of either the respective LBDs or the peptides alone, or without addition of the ligand/agonist (no compound), are all less than 800. Data represent mean ± SEM from three separate experiments.
Figure 7
Figure 7. Portal Vein Infusion of 16:0/18:1-GPC Rescues Hepatic Steatosis in a PPARα-dependent manner
(A) Operative field depicting the portal vein (PV) cannulated with a catheter (pv-cath) positioned at the entry site into the liver (lvr). The catheter is intentionally marked in black ink at its proximal tip to enhance visualization. Labels indicate gall bladder (gb), bile duct (bd), inferior vena cava (ivc), and pancreas (pan). (B) Intraportal 16:0/18:1-GPC treatment protocol. After insertion of the portal vein catheter, C57BL/6 mice (wild type for FAS and either wild type or null for PPARα) were allowed to recover. On day 4, chow was changed to a zero fat diet (ZFD) and the mice received 3 intraportal injections/day of 10 mg/kg 16:0/18:1-GPC sonicated in normal saline/0.5% ethanol/0.5% fatty acid-free BSA or vehicle alone. On the last day before the end of treatment (day 9), mice were fasted for 24 h. (C) At the end of the treatment protocol, liver histological sections were stained with oil red O to visualize neutral lipids (x40 magnification) from wild type (C57/BL6) and PPARα−/− mice treated with 16:0/18:1-GPC or vehicle (Veh). Sections are representative of several animals for each condition. (D) Quantification of hepatic triglyceride content per unit mass of tissue from vehicle and 16:0/18:1-GPC treated C57/BL6 and PPARα−/− mice. Bars represent mean ± SEM of two separate infusion experiments with 5–8 animals per group in each experiment. *, P < 0.05 vs. corresponding Veh. #, P < 0.05 vs. C57/BL6 controls. (E) Expression of hepatic ACO (top panel) and CPT-1 (bottom panel) mRNA by RT-PCR normalized to control L32 ribosomal mRNA following the 16:0/18:1-GPC injections. Data represent mean ± SEM of two independent RT-PCR experiments for each gene with 4 mice per genotype per group. *, P < 0.05 vs. corresponding Veh. #, P < 0.05 vs. C57/BL6 controls. (F) Proposed model for the generation of the endogenous PPARα ligand in liver. FAS yields palmitate (C16:0), and 16:0/18:1-GPC is likely generated through the diacylglycerol (DAG) intermediate and the enzymatic activity of CEPT1 either in the ER or the nucleus. Binding of 16:0/18:1-GPC to PPARα in the nucleus activates transcription machinery (TM) turning on PPARα-dependent genes and affecting hepatic lipid metabolism. ACC, acetyl CoA carboxylase; ER, endoplasmic reticulum.

References

    1. Ayers SD, Nedrow KL, Gillilan RE, Noy N. Continuous nucleocytoplasmic shuttling underlies transcriptional activation of PPARgamma by FABP4. Biochemistry. 2007;46:6744–6752. - PubMed
    1. Barter PJ, Rye KA. Is there a role for fibrates in the management of dyslipidemia in the metabolic syndrome? Arterioscler Thromb Vasc Biol. 2008;28:39–46. - PubMed
    1. Bensinger SJ, Tontonoz P. Integration of metabolism and inflammation by lipid-activated nuclear receptors. Nature. 2008;454:470–477. - PubMed
    1. Bernal-Mizrachi C, Weng S, Feng C, Finck BN, Knutsen RH, Leone TC, Coleman T, Mecham RP, Kelly DP, Semenkovich CF. Dexamethasone induction of hypertension and diabetes is PPARalpha-dependent in LDL receptor-null mice. Nat Med. 2003;9:1069–1075. - PubMed
    1. Billas IM, Moulinier L, Rochel N, Moras D. Crystal structure of the ligand-binding domain of the ultraspiracle protein USP, the ortholog of retinoid X receptors in insects. J Biol Chem. 2001;276:7465–7474. - PubMed

Publication types