. 2009 Sep 1;183(5):3118-29.
doi: 10.4049/jimmunol.0900514. Epub 2009 Jul 31.

TCR repertoire and Foxp3 expression define functionally distinct subsets of CD4+ regulatory T cells

Affiliations

TCR repertoire and Foxp3 expression define functionally distinct subsets of CD4+ regulatory T cells

Michal Kuczma et al. J Immunol. .

Abstract

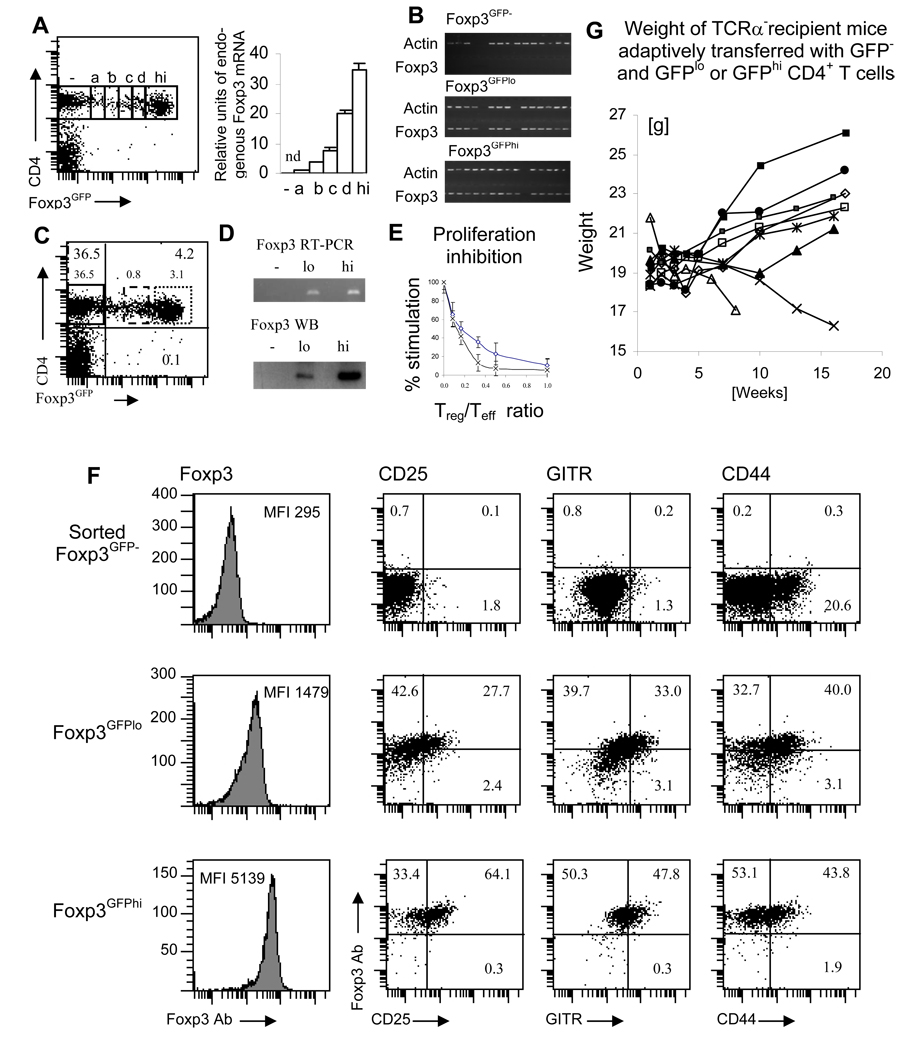
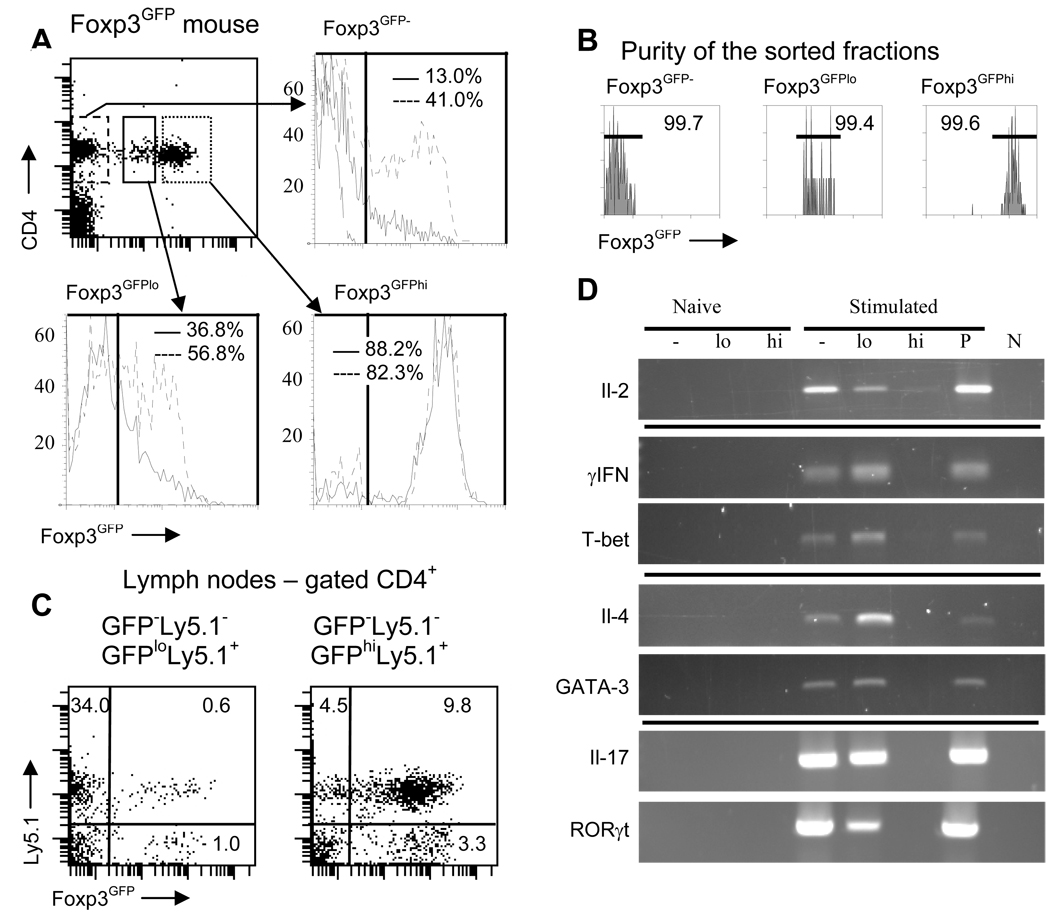
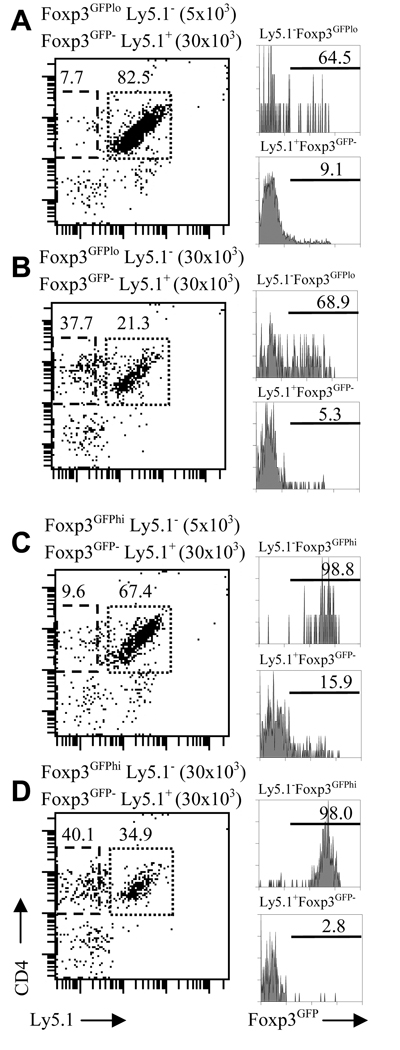
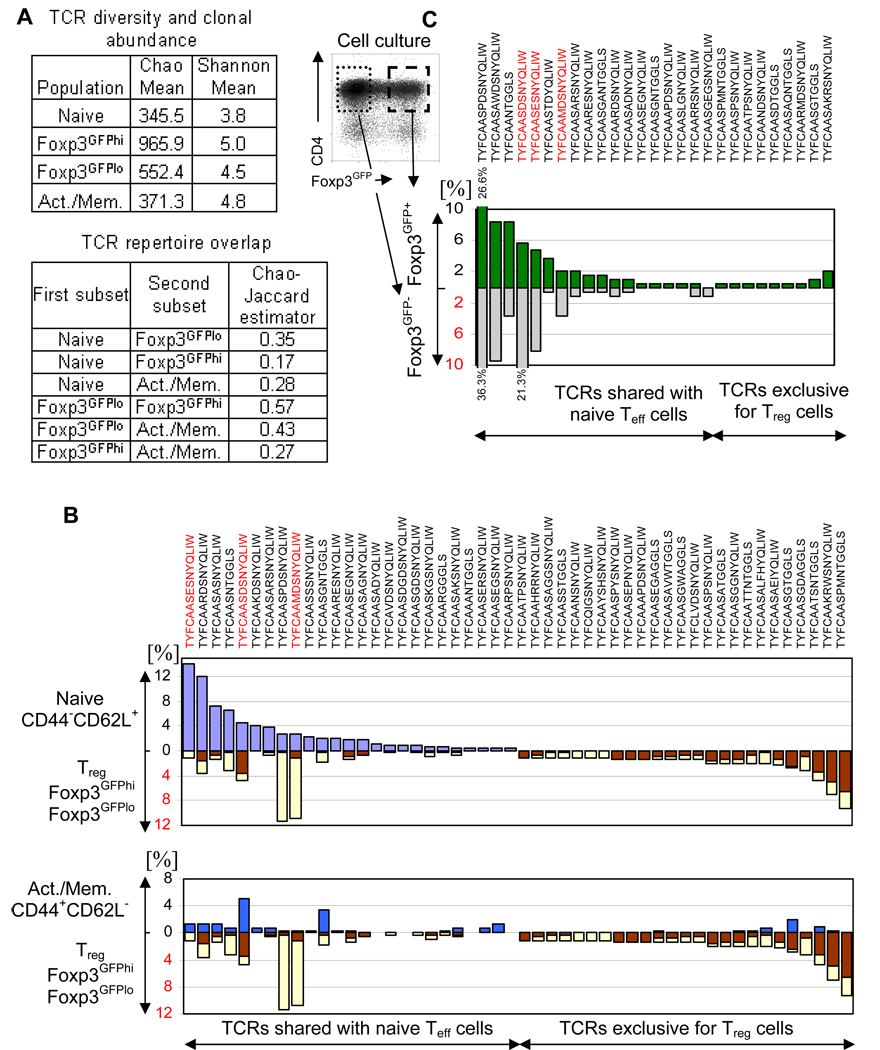
Despite extensive research efforts to characterize peripheral regulatory T (T(reg)) cells expressing transcription factor Foxp3, their subset complexity, phenotypic characteristics, TCR repertoire and Ag specificities remain ambiguous. In this study, we identify and define two subsets of peripheral T(reg) cells differing in Foxp3 expression level and TCR repertoires. T(reg) cells expressing a high level of Foxp3 and TCRs not used by naive CD4(+) T cells present a stable suppressor phenotype and dominate the peripheral T(reg) population in unmanipulated mice. The second T(reg) subset, expressing a lower level of Foxp3 and using TCRs shared with naive CD4(+) T cells constitutes a small fraction of all T(reg) cells in unmanipulated mice and enriches T(reg) population with the same Ag specificities as expressed by activated/effector T cells. This T(reg) subset undergoes extensive expansion during response to Ag when it becomes a major population of Ag-specific T(reg) cells. Thus, T(reg) cells expressing TCRs shared with naive CD4(+) T cells have a flexible phenotype and may down-regulate Foxp3 expression which may restore immune balance at the conclusion of immune response or convert these cells to effector T cells producing inflammatory cytokines.


Conflict of interest statement

Disclosures

The authors have no conflicting financial interests.

Figures

FIGURE 1
FIGURE 1
Analysis of CD4+ Treg cell subsets defined by Foxp3 expression level. (A) The level of the Foxp3 transcript is proportional to the expression of the GFP reporter. Foxp3GFP− and Foxp3GFP+ CD4+ T cells expressing various levels of GFP were sorted and Foxp3 transcript was quantitated by RT-PCR with primers specific for endogenous Foxp3. Sorting gates are shown as rectangles on the histogram. The plot shows relative intensities of DNA bands after scanning the gel image (nd – not detectable). The Foxp3 mRNA level in the cell subset labeled “a” was set as “1”. Experiment was repeated two times. (B) GFP reporter is expressed only in cells expressing endogenous Foxp3 transcript. Single cell analysis of the Foxp3 expression in populations of Foxp3GFP− and Foxp3GFPlo and Foxp3GFPhi CD4+ T cells (sorting gates are shown in C). Actin and Foxp3 were amplified in sorted single cells. (C) Flow cytometry analysis of peripheral lymph node cells stained with CD4. Gates used to sort CD4+ Foxp3GFP− (continuous line), Foxp3GFPlo (broken line) and Foxp3GFPhi (dotted line) Treg cells are shown. (D) Foxp3GFPlo and Foxp3GFPhi Treg cells express low and high levels of Foxp3 transcript and protein. RT-PCR and Western blot analysis of Foxp3 expression in sorted Foxp3GFP−, Foxp3GFPlo and Foxp3GFPhi Treg cells. Experiment was repeated two times. (E) Foxp3GFPlo (open rectangles) and Foxp3GFPhi (crosses) Treg cells suppress proliferation of effector T cells. Typical experiment of three is shown. (F) Foxp3GFPlo and Foxp3GFPhi Treg cells differ in the expression of cell surface markers. Flow cytometry analysis of intracellular Foxp3 expression and cell surface expression of CD25, GITR and CD44. Analysis gates are shown in C. Numbers represent percentage of cells in each quadrant. Representative experiment of three is shown. (G) Weight of the TCRα recipients receiving adoptive transfer of Foxp3GFPlo (□, ◊, Δ, x, *) and Foxp3GFPhi (■, ▪, ▲, ●) cells and co-transferred with Foxp3GFP− cells into TCRα mice. Each line represents individual mouse. All recipients receiving FoxpGFPhi cells remained healthy while two (marked by x, Δ) of the recipients of Foxp3GFPlo cells succumbed to wasting disease.
FIGURE 2
FIGURE 2
Stability of the Treg phenotype of Foxp3GFPlo and Foxp3GFPhi cells. (A) Flow cytometry analysis of Foxp3GFP expression in in vitro cultured sorted CD4+ Foxp3GFP− (dashed line), Foxp3GFPlo (continuous line) and Foxp3GFPhi (dotted line) cells (upper left panel). Cells were stimulated with plate-bound anti-CD3/anti-CD28 antibodies either alone (continuous line) or in the presence of TGFβ and Il-2 (broken line). Foxp3GFP expression in unstimulated CD4+ Foxp3GFP− is shown on the upper right panel (dashed line). Numbers in each plot indicate percentage of Foxp3GFP+ cells. Experiment was repeated three times. (B) Purity of the sorted populations shown in (A). Histograms showing purity of sorted fractions were analyzed on flow cytometer and sorting was done on a cell sorter so the x-axes of the dot plot and histograms have different scale. (C) Foxp3GFP expression in adoptively transferred Foxp3GFPlo (left panel) and Foxp3GFPhi (right panel) cells. Ly5.1+CD4+ Foxp3GFPlo or Ly5.1+Foxp3GFPhi cells were co-transferred with Ly5.1CD4+Foxp3GFP− cells into TCRα chain knockout mice and recipient mice were analyzed after 4 weeks. Gates used for sorting donor populations are shown in (A). At least three recipient mice were analyzed for each adoptive transfer. (D) Cytokine and transcription factor expression in unstimulated or in vitro stimulated populations of Foxp3GFP−, Foxp3GFPlo and Foxp3GFPhi cells. Sorted cells were lysed directly or were stimulated with plate-bound anti-CD3/anti-CD28 antibodies alone for Il-2 detection or in conditions favoring differentiation of Th1, Th2 or Th17 cells. Population of total CD4+ T cells stimulated like experimental samples served as positive control (P). Cytokine expression was analyzed by RT-PCR. PCR reaction without added template was used as a negative control (N).
FIGURE 3
FIGURE 3
Regulation of Foxp3 expression in Foxp3GFP−, Foxp3GFPlo and Foxp3GFPhi cells in in vitro co-culture assays. Foxp3GFP− Teff cells (Ly5.1+, 30×103/well) were stimulated in vitro with soluble anti-CD3 antibody in the presence of low (5×10³/well, A, C) or high (30×103/well, B, D) number of Foxp3GFPlo (A, B) or Foxp3GFPhi (C, D) Treg cells (both Ly5.1) and irradiated splenocytes from TCRα mice. Panels on the left show CD4 and Ly5.1 expression on cultured cells and gates used to define Ly5.1+ Teff or Ly5.1 Treg cells. Histograms on the right show Foxp3 expression in Foxp3GFPlo (A, B) and Foxp3GFPhi (C, D) cells (upper histogram in each pair) and in Teff cells (lower histograms in each pair).
FIGURE 4
FIGURE 4
Flow cytometry analysis of lymph node CD4+ T cells from TCRmini-Foxp3GFP mice. The fraction of CD4+ T cells expressing Foxp3GFP and expression of CD44 and CD62L on Foxp3GFP− cells is shown. Gates used to define Foxp3GFP− cells and subsets of naive CD44CD62L+ and activated CD44+CD62L cells as well as Foxp3GFPlo and Foxp3GFPhi Treg cells for TCR repertoire studies are shown as rectangles. Figure shows representative data of at least five mice analyzed.
FIGURE 5
FIGURE 5
Analysis of the TCR repertoire in TCRmini-Foxp3GFP mice. (A) Estimation of the TCR repertoire diversity and clonal abundance (upper table) and TCR repertoire overlap (lower table) of naive and activated/memory Teff cells and Foxp3GFPlo and Foxp3GFPhi Treg cells. (B) Comparison of the frequencies (%) of most abundant TCRs in naive Teff (purple bars) and Treg (brown bars – FoxpGFPhi Treg, yellow bars – Foxp3GFPlo Treg) subsets (upper panel) and in activated/memory (blue bars) subset (lower panel). (C) Partitioning of the most abundant TCRs sequenced from in vitro stimulated Foxp3GFP+ cells (combined Foxp3GFPlo and Foxp3GFPhi cells) between T cells that retained and lost Foxp3 expression. Percentages of a particular TCR in Foxp3GFP− and Foxp3GFP+ subsets are shown on the plot (numbers above and below bars show percentages for the most abundant clones). Sorted Foxp3GFP+ cells were stimulated in vitro. After 5 days, single cells were sorted (sorting gates are shown on the plot) into Foxp3GFP+ and Foxp3GFP− subsets and TCRα chains were amplified and sequenced. Sequences of the TCR α chain CDR3 regions are shown in (B) and (C), red sequences mark T cell clones specific for Ep63K peptide.
FIGURE 6
FIGURE 6
Foxp3 is upregulated in Foxp3GFP− cells in peripheral lymph nodes of lymphoreplete mice. (A) TCRmini-Foxp3GFP and wild type C57BL6 Foxp3GFP mice have similar number of cells in peripheral lymph nodes. The plot shows average number of lymph node cells isolated from axillary, brachial and inguinal lymph nodes. Twelve mice in each group was analyzed. (B) CD4+ Foxp3GFP− cells upregulate Foxp3GFP expression when transferred into lymphoreplete TCRmini-Foxp3GFP mice. Flow cytometer sorted CD4+ Foxp3GFP− cells (3×10⁶/mouse) from Ly5.1+Foxp3GFP mice expressing wild type TCR repertoire were transferred into Ly5.1 TCRmini-Foxp3GFP expressing restricted TCR repertoire. Recipient mice were analyzed 8 days after transfer. Three recipient mice were analyzed. (C) CD4+ T cells in TCRmini mice reconstituted with sorted CD4+ Foxp3GFP− cells do not undergo homeostatic expansion. Percentage of CD4+ T cells in peripheral blood of recipient mice is shown before (left column) and after (middle column) adoptive transfer. Three recipient mice were examined. For comparison percentage of CD4+ T cells in peripheral blood of Foxp3GFP mice expressing wild type TCR repertoire is shown (right column).
FIGURE 7
FIGURE 7
Analysis of the TCR repertoire in TCRmini-Foxp3GFP mice immunized with Ep63K peptide. (A) Naive TCR repertoire in TCRmini-Foxp3GFP mice is enriched in CD4+ cells specific for Ep63K peptide. Lymph node cells from unmanipulated mice proliferate in response to Ep63K peptide (●, ■) but not to a control peptide derived from IgGVH (○, □). Two TCRmini mice were analyzed. (B) Amino-acid sequences of TCRα chain CDR3 regions of Ep63K-specific CD4+ T cell hybridomas obtained from TCRmini-Foxp3GFP mice. (C) Flow cytometry analysis of the draining lymph node cells from TCRmini-Foxp3GFP mice immunized with Ep63K and CFA. CD4+ T cells expressing Foxp3GFP are shown. Gates used to define Foxp3GFP− cells (continuous black line) and subsets of naive CD44CD62L+ (yellow continuous line) and activated CD44+CD62L cells (red dotted line) as well as Foxp3GFPlo (dashed line) and Foxp3GFPhi Treg cells (dotted line) for TCR repertoire studies are shown as rectangles. (D) Frequencies (%) of the 25 most abundant T cell clones from activated subset (blue bars) are shown with the frequencies of the Treg clones expressing the same TCR. FoxpGFPhi (brown bars) and Foxp3GFPlo Treg (yellow bars) subsets (upper panel) are shown. (E) Frequencies (%) of the most abundant Foxp3GFP+ Treg clones (combined Foxp3GFPlo and Foxp3GFPhi clones) in the draining lymph nodes of immunized (grey bars) TCRmini-Foxp3GFP mice are compared with frequencies of the same TCRs in Treg subset of unmanipulated mice (light blue bars). TCRs shared with Teff cells and exclusively expressed by Treg cells are indicated by the arrows under the plot. Sequences of the TCRα chain CDR3 regions are shown in (D) and (E), red sequences mark T cell clones specific for Ep63K peptide. (F) Clonal abundance (%) of Ep63K-specific T cell clones in naive (purple bars) and activated (blue bars) subsets of Teff cells and Foxp3GFPlo (yellow bars) and Foxp3GFPhi (brown bars) Treg cells in control TCRmini-Foxp3GFP mice (upper panel) and mice immunized with Ep63K peptide (lower panel). Names of hybridomas expressing a particular TCRα chain are shown above upper panels.

References

    1. Sakaguchi S, Sakaguchi N, Shimizu J, Yamazaki S, Sakihama T, Itoh M, Kuniyasu Y, Nomura T, Toda M, Takahashi T. Immunologic tolerance maintained by CD25+ CD4+ regulatory T cells: their common role in controlling autoimmunity, tumor immunity, and transplantation tolerance. Immunol. Rev. 2001;182:18–32. - PubMed
    1. Fontenot JD, Gavin MA, Rudensky AY. Foxp3 programs the development and function of CD4+CD25+ regulatory T cells. Nat. Immunol. 2003;4:330–336. - PubMed
    1. Hori S, Nomura T, Sakaguchi S. Control of regulatory T cell development by the transcription factor Foxp3. Science. 2003;299:1057–1061. - PubMed
    1. Kretschmer K, Apostolou I, Hawiger D, Khazaie K, Nussenzweig MC, von BH. Inducing and expanding regulatory T cell populations by foreign antigen. Nat. Immunol. 2005;6:1219–1227. - PubMed
    1. Knoechel B, Lohr J, Kahn E, Bluestone JA, Abbas AK. Sequential development of interleukin 2-dependent effector and regulatory T cells in response to endogenous systemic antigen. J. Exp. Med. 2005;202:1375–1386. - PMC - PubMed

Publication types

MeSH terms