. 2009 Nov 1;18(21):4118-29.
doi: 10.1093/hmg/ddp360. Epub 2009 Jul 31.

Copy number variation influences gene expression and metabolic traits in mice

Affiliations

Copy number variation influences gene expression and metabolic traits in mice

Luz D Orozco et al. Hum Mol Genet. .

Abstract

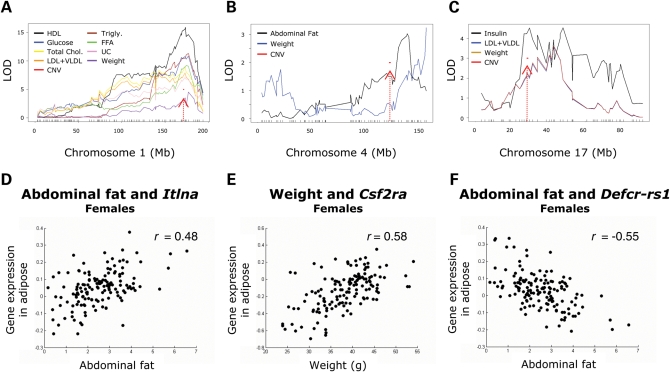
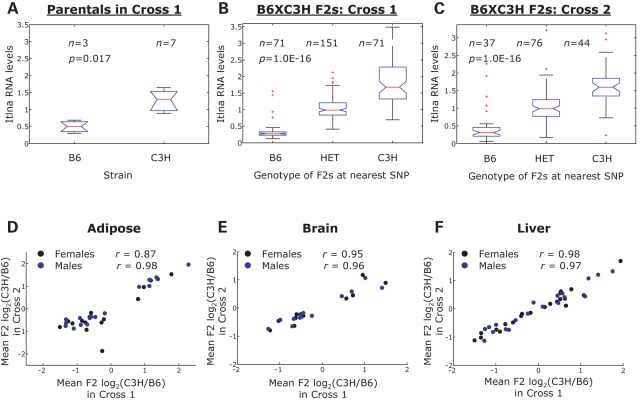
Copy number variants (CNVs) are genomic segments which are duplicated or deleted among different individuals. CNVs have been implicated in both Mendelian and complex traits, including immune and behavioral disorders, but the study of the mechanisms by which CNVs influence gene expression and clinical phenotypes in humans is complicated by the limited access to tissues and by population heterogeneity. We now report studies of the effect of 19 CNVs on gene expression and metabolic traits in a mouse intercross between strains C57BL/6J and C3H/HeJ. We found that 83% of genes predicted to occur within CNVs were differentially expressed. The expression of most CNV genes was correlated with copy number, but we also observed evidence that gene expression was altered in genes flanking CNVs, suggesting that CNVs may contain regulatory elements for these genes. Several CNVs mapped to hotspots, genomic regions influencing expression of tens or hundreds of genes. Several metabolic traits including cholesterol, triglycerides, glucose and body weight mapped to three CNVs in the genome, in mouse chromosomes 1, 4 and 17. Predicted CNV genes, such as Itlna, Defcr-1, Trim12 and Trim34 were highly correlated with these traits. Our results suggest that CNVs have a significant impact on gene expression and that CNVs may be playing a role in the mechanisms underlying metabolic traits in mice.


Figures

Figure 1.
Figure 1.
Mouse CNVs influence gene expression levels. (A) The number of eQTL with LOD score >4.3 in adipose tissue and the position of CNVs in the mouse genome. The genomic locations of CNVs are marked by red diamonds and red vertical bars and eQTL counts are plotted as the average count in a 2 Mb moving window. (B) Microarray expression levels are variable in genes found within or near CNVs in a segment of chromosome 7 carrying two CNVs. The absolute fold change in gene expression between B6 and C3H groups is shown for 150 genes in a 6 Mb window. (C) The concordance between gene expression log2(C3H/B6) ratios and CGH log2(C3H/B6) ratios. The CGH ratios are shown as an average of a five probe moving window.
Figure 2.
Figure 2.
CNV mapping genes are regulated in cis. Allelic imbalance shows that CNV genes (A) Klrk1, (B) CD244 and (C) Trim12 are regulated in cis. We used semi-quantitative sequence analysis in adipose cDNA from B6, C3H and B6×C3H F1 in cross 1, where we determined the ratio of the B6 and C3H alleles in the overall transcript levels of the F1 mice.
Figure 3.
Figure 3.
Impact of CNVs on metabolic traits. (AC) Clinical QTL mapping reveals that CNVs overlap multiple cQTL in chromosomes 1, 4 and 17. (DF) The expression levels of CNV genes are correlated with metabolic traits in B6×C3H F2 mice. The expression levels correspond to adipose tissue and F2 female mice. r Values correspond to the Pearson's correlation coefficient.
Figure 4.
Figure 4.
Effect of CNV on gene expression replicates in two independent crosses. (A) Itlna microarray expression levels in the parental inbred strains B6 and C3H from the first cross; the P-value corresponds to a two-sided t-test. (B) Itlna expression levels in B6×C3H F2 mice in first cross and (C) second cross. The P-values correspond to a one-way ANOVA test among the B6, HET and C3H F2 groups. Gene expression levels are highly correlated between the first and second crosses in adipose (D), brain (E) and liver (F) tissues. Each dot plotted represents a differentially expressed gene found in a CNV. The expression values shown correspond to the mean log2(C3H/B6) ratio of the C3H to B6 F2 groups in each cross. r Values correspond to the Pearson's correlation coefficient.
Figure 5.
Figure 5.
Mouse eQTL hotspot coincides with highly conserved non-coding sequences present in mouse CNVs. (A) A CNV in chromosome 3 coincides with the 95% confidence interval of 27 eQTL. Each curve represents an eQTL with LOD score >4.3 from female liver in cross 1. The red bar marks the position of the CNV. (B) The location of the CNV and neighboring genes in a 2 Mb window from the UCSC genome browser in Build37. Cross-species conservation for the CNV sequences is shown in (C), where the base mouse genome sequence (Build 37) is compared with the rat, human, rhesus macaque, dog, horse and chicken sequences. The degree of conservation is plotted on the y-axis as % identity over a 100 bp window. Highly conserved regions are highlighted under the curve, with a red color specifying non-coding sequences.

References

    1. Jakobsson M., Scholz S.W., Scheet P., Gibbs J.R., VanLiere J.M., Fung H.C., Szpiech Z.A., Degnan J.H., Wang K., Guerreiro R., et al. Genotype, haplotype and copy-number variation in worldwide human populations. Nature. 2008;451:998–1003. - PubMed
    1. Redon R., Ishikawa S., Fitch K.R., Feuk L., Perry G.H., Andrews T.D., Fiegler H., Shapero M.H., Carson A.R., Chen W., et al. Global variation in copy number in the human genome. Nature. 2006;444:444–454. - PMC - PubMed
    1. Babcock M., Yatsenko S., Hopkins J., Brenton M., Cao Q., de Jong P., Stankiewicz P., Lupski J.R., Sikela J.M., Morrow B.E. Hominoid lineage specific amplification of low-copy repeats on 22q11.2 (LCR22s) associated with velo-cardio-facial/digeorge syndrome. Hum. Mol. Genet. 2007;16:2560–2571. - PubMed
    1. Lee A.S., Gutierrez-Arcelus M., Perry G.H., Vallender E.J., Johnson W.E., Miller G.M., Korbel J.O., Lee C. Analysis of copy number variation in the rhesus macaque genome identifies candidate loci for evolutionary and human disease studies. Hum. Mol. Genet. 2008;17:1127–1136. - PubMed
    1. Graubert T.A., Cahan P., Edwin D., Selzer R.R., Richmond T.A., Eis P.S., Shannon W.D., Li X., McLeod H.L., Cheverud J.M., et al. A high-resolution map of segmental DNA copy number variation in the mouse genome. PLoS Genet. 2007;3:e3. - PMC - PubMed

Publication types

MeSH terms