. 2009 Sep;12(9):1106-13.
doi: 10.1038/nn.2365. Epub 2009 Aug 2.

Chemotropic guidance facilitates axonal regeneration and synapse formation after spinal cord injury

Affiliations

Chemotropic guidance facilitates axonal regeneration and synapse formation after spinal cord injury

Laura Taylor Alto et al. Nat Neurosci. 2009 Sep.

Abstract

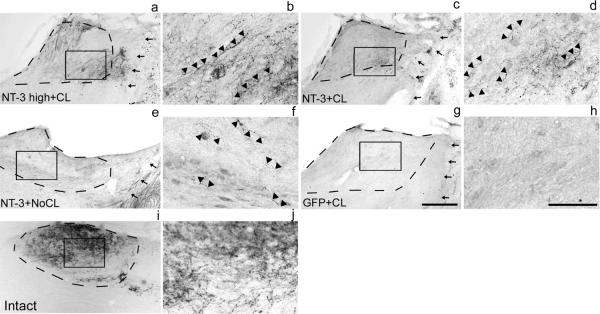
A principal objective of spinal cord injury (SCI) research is the restoration of axonal connectivity to denervated targets. We tested the hypothesis that chemotropic mechanisms would guide regenerating spinal cord axons to appropriate brainstem targets. We subjected rats to cervical level 1 (C1) lesions and combinatorial treatments to elicit axonal bridging into and beyond lesion sites. Lentiviral vectors expressing neurotrophin-3 (NT-3) were then injected into an appropriate brainstem target, the nucleus gracilis, and an inappropriate target, the reticular formation. NT-3 expression in the correct target led to reinnervation of the nucleus gracilis in a dose-related fashion, whereas NT-3 expression in the reticular formation led to mistargeting of regenerating axons. Axons regenerating into the nucleus gracilis formed axodendritic synapses containing rounded vesicles, reflective of pre-injury synaptic architecture. Thus, we report for the first time, to the best of our knowledge, the reinnervation of brainstem targets after SCI and an essential role for chemotropic axon guidance in target selection.


Figures

Figure 1
Figure 1. Experimental paradigm
1) Nucleus gracilis neurons were retrogradely labeled using bilateral injection of fluorogold (FG, orange) into the ventro-postero-lateral (VPL) thalamus one week prior to dorsal column lesions. 2) Some animals received bilateral sciatic nerve conditioning lesions, while controls received no sciatic nerve lesions. 3) 7 days later a wire knife was used to transect the dorsal columns approximately 1.5 mm caudal to the obex, and marrow stromal cells (MSCs) were grafted into the lesion site. 4) Immediately after grafting, lentiviral vectors expressing both NT-3 and GFP (“Lenti-NT-3”, GFP is expressed from an internal ribosome entry site [IRES] in the same construct) or GFP alone (“Lenti-GFP”) were injected into the nucleus gracilis and median reticular nucleus bilaterally, slightly rostral and lateral to the obex, or to the nucleus gracilis alone. 5) 4 weeks later, ascending sensory tracts were bilaterally labeled using cholera toxin B subunit (CTB) injections into the sciatic nerve; 3 days after CTB injections, animals were perfused.
Figure 2
Figure 2. Transected ascending sensory axons extend toward Lenti-NT-3-transduced cells in the denervated nucleus gracilis
Multiple labeling for (a) CTB to identify ascending sensory axons, (b) GFAP to indicate the lesion/graft borders (arrows), (c) GFP to identify NT-3-GFP vector-transduced cells, and (d) fluorogold (FG) fluorescence to identify nucleus gracilis neurons, in a sagittal lower medulla/spinal cord section 4 weeks after dorsal column lesion, cell grafting and lenti-NT-3 gene delivery (200 μg/ml) to the nucleus gracilis (Lenti-NT-3 high+CL group). Dashed lines encircle the nucleus gracilis. Boxes 1 and 2 are shown at higher magnification in e-g and h-j, respectively. (e) In a region containing NT-3-GFP expression at the rostral graft/host border, (f) CTB-labeled axons cross the lesion border (dashed lines) into rostral host tissue. (g) Merge of e and f with CTB-labeled axons pseudo-colored in red. (h) Regions of NT-3-GFP expression overlap with regions containing FG-labeled nucleus gracilis neurons, and (i) CTB-labeled axons are present in these regions. (j) Merge of h and i with axons pseudo-colored in red. Scale bars: d, 250 μm; e, 100 μm; f, 50 μm.
Figure 3
Figure 3. Comparison of axon growth into the nucleus gracilis after viral GFP or NT-3 delivery with or without conditioning lesions
(a-f) Axons were observed regenerating beyond the rostral lesion border (arrows) and into the nucleus gracilis (dashed lines) in animals that received (a,b) high titer NT-3 virus delivered to the nucleus gracilis plus conditioning lesions (Lenti-NT-3 high+CL group); (c,d) standard titer NT-3 virus delivered to the gracile and reticular nuclei plus conditioning lesions (Lenti-NT-3+CL group); and (e,f) standard titer NT-3 virus delivered to the gracile and reticular nuclei without conditioning lesions (Lenti-NT-3+NoCl group). The greatest number of axons was observed in animals with combinatorial treatment (a-d), and among these 2 groups, more axons were observed when (a,b) high titer NT-3 virus was delivered to the nucleus gracilis (See Fig. 4). In contrast, no axons were observed within the nucleus gracilis in animals that received (g,h) GFP lentivirus delivery plus conditioning lesions (Lenti-GFP+CL group), or GFP lentivirus alone (Lenti-GFP+NoCL, not shown). (i,j) Innervation in the intact nucleus gracilis is shown for comparison. Panels b,d,f and h and j are high magnification of boxes in panels a,c,e,g and i, respectively. Axons are indicated by arrowheads. Nucleus gracilis outlines (dashed lines) were established using Fluorogold fluorescence. Scale bars: g, 250 μm; h, 100 μm.
Figure 4
Figure 4. Quantification of CTB-labeled axons and reporter gene expression in the nucleus gracilis
(a) CTB-labeled axonal profiles within the nucleus gracilis were observed only in subjects that received lenti-NT-3 injections. The combination of lenti-NT-3 injections and conditioning lesions (NT-3+CL) elicited significantly greater axon growth into the target nucleus than control groups that received GFP-expressing vectors (GFP+CL and GFP+NoCL, Kruskall-Wallis p=0.0003, posthoc Dunn's, **p<0.01). Axon density among subjects that received lenti-NT-3 alone, without conditioning lesions (NT-3+No CL), did not differ significantly from GFP controls (NS). (b) Animals that received higher dose NT-3 vector (NT-3 high+CL) had significantly more regenerating axons in the nucleus gracilis than subjects treated with the lower “standard” vector dose (NT-3+CL, two-tailed t test, *p<0.05). (c) The proportion of the nucleus gracilis exhibiting reporter gene (GFP) expression was significantly higher in animals that received high titer lenti-NT-3 virus compared to animals that received a standard titer NT-3 vector dose (ANOVA, p=0.03, Fisher's PLSD, *p<0.05). (d) Axon density after NT-3 treatment was significantly lower than normal innervation of the nucleus gracilis (ANOVA, p<0.0001, Dunnett's posthoc test comparing all injured/treated groups to intact animals, ***p<0.001), but NT-3 high+CL treatment restored 27% of pre-injury axon density. Values are mean ± s.e.m. CL, conditioning lesion; NT-3 high, 200 μg/ml lenti-NT-3 vector.
Figure 5
Figure 5. Lesioned axons regenerate to ectopic regions when NT-3 is ectopically expressed
(a) CTB-labeled axons regenerate into the medullary reticular nucleus (boxes) when (b) lenti-NT-3 virus is injected into this ectopic location. Dashed lines encircle the nucleus gracilis (Grac). Boxes 1 and 2 are shown at high magnification in c,d and e,f, respectively. (c,e) Ectopic axons extend into regions of (d,f) NT-3 expression, indicated by the reporter gene GFP. CTB labeled axons are pseudo-colored in red in d and f. Scale bars: b, 250 μm; c,d, 100 μm.
Figure 6
Figure 6. Regenerating axons form new synapses in the denervated nucleus gracilis
(a) A confocal stack shows many CTB-labeled axons (red) in close proximity to FG-labeled target neurons (green) in nucleus gracilis in an animal that received NT-3 high+CL treatment. (b) A single plane confocal image indicates close apposition of a CTB-labeled axon (arrowheads) to a FG-labeled dendrite (green); arrow indicates a bouton-like structure. Inset in single confocal plane shows intimate association between a CTB-labeled axon and FG-labeled target dendrite. (c) A CTB-labeled bouton in the nucleus gracilis of an animal that also received NT-3 high+CL treatment is identified under the electron microscope by the electron-dense reaction product produced by CTB immunohistochemistry. Multiple synaptic specializations are present (arrows), and dendritic processes (d) protrude through the axoplasm. (d) High magnification of boxed area in c, highlighting a synaptic contact. The synaptic specialization is asymmetric (top inset); electron dense labeling indicates synaptic vesicles surrounded by the CTB reaction product (bottom inset). (e) The regenerated synapse resembles a CTB-labeled synapse from an intact animal (shown), which is also characterized by multiple synaptic specializations (arrows) and dark background labeling identifying CTB. Scale bars: a, 5 μm; b, 2.5 μm (inset 3-fold magnification); c, 1 μm; d, 0.4 μm (insets 5-fold magnification); e, 0.75 μm.
Figure 7
Figure 7. Electrophysiological responses in the nucleus gracilis evoked by sciatic nerve stimulation in intact and C1 injured animals
(a) Representative traces from a single recording site (intact animal). Baseline recordings (Pre KA), after addition of kynurenic acid [50 μM] (Post KA), following washout of kynurenic acid with artificial cerebrospinal fluid (Post wash) and after dorsal column transection at T3 (Post DC cut). Arrowheads indicate pre- and post-stimulus windows for calculating root mean square (RMS) power spectrum responses. (b) Average responses (n=6 animals). Repeated measures ANOVA p=0.006, Fisher's PLSD, *p<0.05, mean ± s.e.m. (c) Responses to sciatic nerve stimulation recorded in the nucleus gracilis in: i) intact animals, ii) intact animals with conditioning lesions (CL), iii) C1 lesioned animals with GFP high+CL treatment, and iv) C1 lesioned animals with NT-3 high+CL treatment. Vertical lines indicate the maximum, minimum and mean RMS response values obtained from all recording sites for individual animals. Green dotted line indicates the maximum RMS response recorded in GFP+CL animals. Responses exceeded the maximum control response at two sites in one NT-3+CL animal (red arrow). (d) However, these recordings did not resemble evoked activity (top 2 traces); responses were comparable to those in GFP-treated control animals (bottom trace). (e) Axons in the intact dorsal columns and axons ascending toward the cervical lesion site (shown) were myelinated, while axons regenerating (f) within and (g) beyond the lesion/graft site in combinatorially treated subjects were not myelinated, as revealed by double labeling for CTB and myelin-associated glycoprotein (MAG).

Comment in

  • Reconnecting injured nerves.
    Cho M. Cho M. Nat Neurosci. 2009 Sep;12(9):1085. doi: 10.1038/nn0909-1085. Nat Neurosci. 2009. PMID: 19710648 No abstract available.

References

    1. McQuarrie IG, Grafstein B, Gershon MD. Axonal regeneration in the rat sciatic nerve: effect of a conditioning lesion and of dbcAMP. Brain Res. 1977;132:443–453. - PubMed
    1. Schreyer DJ, Skene JH. Injury-associated induction of GAP-43 expression displays axon branch specificity in rat dorsal root ganglion neurons. J Neurobiol. 1993;24:959–970. - PubMed
    1. Chen DF, Schneider GE, Martinou JC, Tonegawa S. Bcl-2 promotes regeneration of severed axons in mammalian CNS. Nature. 1997;385:434–439. - PubMed
    1. Goldberg JL, Klassen MP, Hua Y, Barres BA. Amacrine-signaled loss of intrinsic axon growth ability by retinal ganglion cells. Science. 2002;296:1860–1864. - PubMed
    1. Yiu G, He Z. Glial inhibition of CNS axon regeneration. Nat Rev Neurosci. 2006;7:617–627. - PMC - PubMed

Publication types

MeSH terms