

Efficient, Distributed and Interactive Neuroimaging Data Analysis Using the LONI Pipeline
- PMID: 19649168
- PMCID: PMC2718780
- DOI: 10.3389/neuro.11.022.2009
Efficient, Distributed and Interactive Neuroimaging Data Analysis Using the LONI Pipeline
Abstract
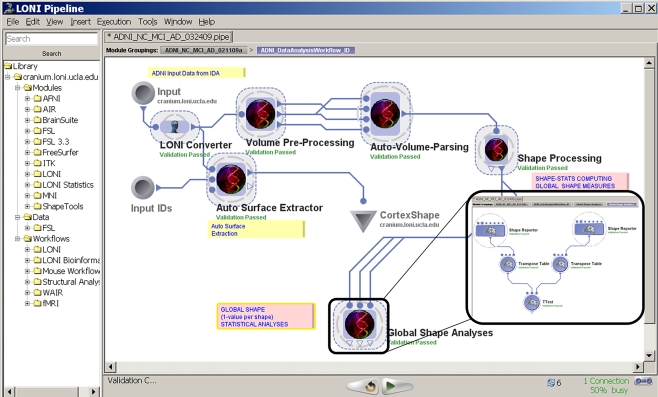
The LONI Pipeline is a graphical environment for construction, validation and execution of advanced neuroimaging data analysis protocols (Rex et al., 2003). It enables automated data format conversion, allows Grid utilization, facilitates data provenance, and provides a significant library of computational tools. There are two main advantages of the LONI Pipeline over other graphical analysis workflow architectures. It is built as a distributed Grid computing environment and permits efficient tool integration, protocol validation and broad resource distribution. To integrate existing data and computational tools within the LONI Pipeline environment, no modification of the resources themselves is required. The LONI Pipeline provides several types of process submissions based on the underlying server hardware infrastructure. Only workflow instructions and references to data, executable scripts and binary instructions are stored within the LONI Pipeline environment. This makes it portable, computationally efficient, distributed and independent of the individual binary processes involved in pipeline data-analysis workflows. We have expanded the LONI Pipeline (V.4.2) to include server-to-server (peer-to-peer) communication and a 3-tier failover infrastructure (Grid hardware, Sun Grid Engine/Distributed Resource Management Application API middleware, and the Pipeline server). Additionally, the LONI Pipeline provides three layers of background-server executions for all users/sites/systems. These new LONI Pipeline features facilitate resource-interoperability, decentralized computing, construction and validation of efficient and robust neuroimaging data-analysis workflows. Using brain imaging data from the Alzheimer's Disease Neuroimaging Initiative (Mueller et al., 2005), we demonstrate integration of disparate resources, graphical construction of complex neuroimaging analysis protocols and distributed parallel computing. The LONI Pipeline, its features, specifications, documentation and usage are available online (http://Pipeline.loni.ucla.edu).
Keywords: LONI Pipeline; data provenance; neuroimaging; resources; software tools; tool integration; tool interoperability; workflows.
Figures


References
-
- Bowers S., McPhillips T., Ludäscher B. (2008). Provenance in collection-oriented scientific workflows. Concur. Comput. Prac. Exp. 20, 519–52910.1002/cpe.1226 - DOI
-
- Callahan S., Freire J., Santos E., Scheidegger C. E., Silva C. T., Vo H. T. (2006). VisTrails: Visualization Meets Data Management, in Proceedings of the 2006 ACM SIGMOD International Conference on Management of Data. Chicago, IL, ACM
-
- Churches D., Gombas G., Harrison A., Maassen J., Robinson C., Shields M., Taylor I., Wang I. (2006). Programming scientific and distributed workflow with Triana services. Concur. Comput. Prac. Exp. 18, 1021–103710.1002/cpe.992 - DOI
Grants and funding
LinkOut - more resources
Full Text Sources
Other Literature Sources