Synchronization in primate cerebellar granule cell layer local field potentials: basic anisotropy and dynamic changes during active expectancy
- PMID: 19649170
- PMCID: PMC2718782
- DOI: 10.3389/neuro.03.006.2009
Synchronization in primate cerebellar granule cell layer local field potentials: basic anisotropy and dynamic changes during active expectancy
Abstract
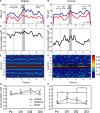
The cerebellar cortex is remarkable for its organizational regularity, out of which task-related neural networks should emerge. In Purkinje cells, both complex and simple spike network patterns are evident in sensorimotor behavior. However, task-related patterns of activity in the granule cell layer (GCL) have been less studied. We recorded local field potential (LFP) activity simultaneously in pairs of GCL sites in monkeys performing an active expectancy (lever-press) task, in passive expectancy, and at rest. LFP sites were selected when they showed strong 10-25 Hz oscillations; pair orientation was in stereotaxic sagittal and coronal (mainly), and diagonal. As shown previously, LFP oscillations at each site were modulated during the lever-press task. Synchronization across LFP pairs showed an evident basic anisotropy at rest: sagittal pairs of LFPs were better synchronized (more than double the cross-correlation coefficients) than coronal pairs, and more than diagonal pairs. On the other hand, this basic anisotropy was modifiable: during the active expectancy condition, where sagittal and coronal orientations were tested, synchronization of LFP pairs would increase just preceding movement, most notably for the coronal pairs. This lateral extension of synchronization was not observed in passive expectancy. The basic pattern of synchronization at rest, favoring sagittal synchrony, thus seemed to adapt in a dynamic fashion, potentially extending laterally to include more cerebellar cortex elements. This dynamic anisotropy in LFP synchronization could underlie GCL network organization in the context of sensorimotor tasks.
Keywords: cerebellar cortex; granule cell layer; network activity; oscillations; sensorimotor; synchronization.
Figures


Similar articles
-
Local field potential oscillations in primate cerebellar cortex: synchronization with cerebral cortex during active and passive expectancy.J Neurophysiol. 2005 Apr;93(4):2039-52. doi: 10.1152/jn.00080.2004. Epub 2004 Dec 8. J Neurophysiol. 2005. PMID: 15590736
-
Local field potential oscillations in primate cerebellar cortex: modulation during active and passive expectancy.J Neurophysiol. 2002 Aug;88(2):771-82. doi: 10.1152/jn.2002.88.2.771. J Neurophysiol. 2002. PMID: 12163529
-
Synchronization of neurons during local field potential oscillations in sensorimotor cortex of awake monkeys.J Neurophysiol. 1996 Dec;76(6):3968-82. doi: 10.1152/jn.1996.76.6.3968. J Neurophysiol. 1996. PMID: 8985893
-
Oscillatory activity in sensorimotor cortex of awake monkeys: synchronization of local field potentials and relation to behavior.J Neurophysiol. 1996 Dec;76(6):3949-67. doi: 10.1152/jn.1996.76.6.3949. J Neurophysiol. 1996. PMID: 8985892
-
Linking oscillations in cerebellar circuits.Front Neural Circuits. 2013 Jul 29;7:125. doi: 10.3389/fncir.2013.00125. eCollection 2013. Front Neural Circuits. 2013. PMID: 23908606 Free PMC article. Review.
Cited by
-
θ-Frequency resonance at the cerebellum input stage improves spike timing on the millisecond time-scale.Front Neural Circuits. 2013 Apr 10;7:64. doi: 10.3389/fncir.2013.00064. eCollection 2013. Front Neural Circuits. 2013. PMID: 23596398 Free PMC article.
-
Oscillations, Timing, Plasticity, and Learning in the Cerebellum.Cerebellum. 2016 Apr;15(2):122-38. doi: 10.1007/s12311-015-0665-9. Cerebellum. 2016. PMID: 25808751 Review.
-
Diurnal influences on electrophysiological oscillations and coupling in the dorsal striatum and cerebellar cortex of the anesthetized rat.Front Syst Neurosci. 2014 Sep 15;8:145. doi: 10.3389/fnsys.2014.00145. eCollection 2014. Front Syst Neurosci. 2014. PMID: 25309348 Free PMC article.
-
Discovery and rediscoveries of Golgi cells.J Physiol. 2010 Oct 1;588(Pt 19):3639-55. doi: 10.1113/jphysiol.2010.189605. J Physiol. 2010. PMID: 20581044 Free PMC article. Review.
-
Cerebellar Cortex 4-12 Hz Oscillations and Unit Phase Relation in the Awake Rat.Front Syst Neurosci. 2020 Nov 10;14:475948. doi: 10.3389/fnsys.2020.475948. eCollection 2020. Front Syst Neurosci. 2020. PMID: 33240052 Free PMC article.
References
-
- Bell C. C., Grimm R. J. (1969). Discharge properties of Purkinje cells recorded on single and double microelectrodes. J. Neurophysiol. 32, 1044–1055 - PubMed
-
- Bloedel J. R. (1992). Functional heterogeneity with structural homogeneity: how does the cerebellum operate? Behav. Brain Sci. 15, 666–678
LinkOut - more resources
Full Text Sources
Research Materials

