

The random nature of genome architecture: predicting open reading frame distributions
- PMID: 19649247
- PMCID: PMC2714469
- DOI: 10.1371/journal.pone.0006456
The random nature of genome architecture: predicting open reading frame distributions
Abstract
Background: A better understanding of the size and abundance of open reading frames (ORFS) in whole genomes may shed light on the factors that control genome complexity. Here we examine the statistical distributions of open reading frames (i.e. distribution of start and stop codons) in the fully sequenced genomes of 297 prokaryotes, and 14 eukaryotes.
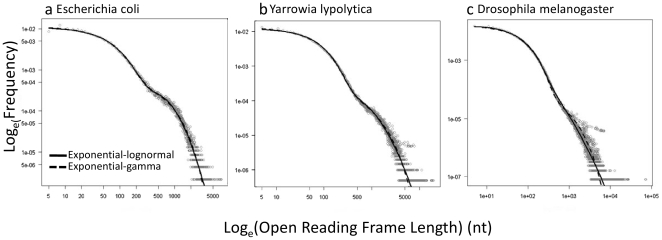
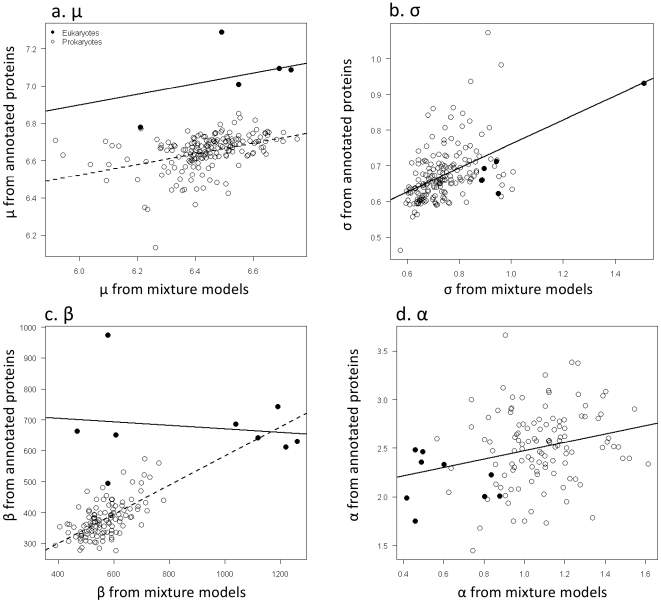
Methodology/principal findings: By fitting mixture models to data from whole genome sequences we show that the size-frequency distributions for ORFS are strikingly similar across prokaryotic and eukaryotic genomes. Moreover, we show that i) a large fraction (60-80%) of ORF size-frequency distributions can be predicted a priori with a stochastic assembly model based on GC content, and that (ii) size-frequency distributions of the remaining "non-random" ORFs are well-fitted by log-normal or gamma distributions, and similar to the size distributions of annotated proteins.
Conclusions/significance: Our findings suggest stochastic processes have played a primary role in the evolution of genome complexity, and that common processes govern the conservation and loss of functional genomics units in both prokaryotes and eukaryotes.
Conflict of interest statement
Figures
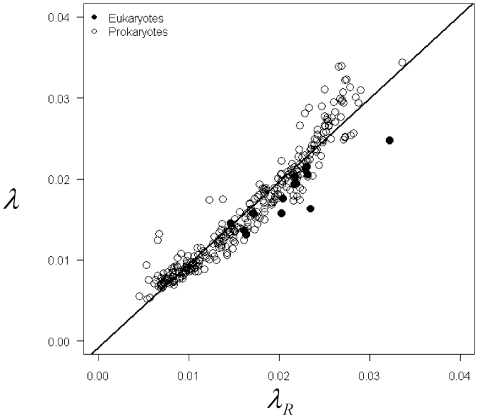
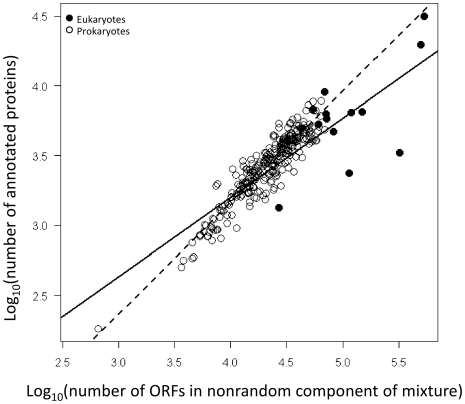
 in Eqs. 1–2) were linearly related to the expected value for a random sequence of a given GC content,
  , with a slope statistically indistinguishable from 1 and an intercept near 0 (P>0.05, r2 = 0.92).
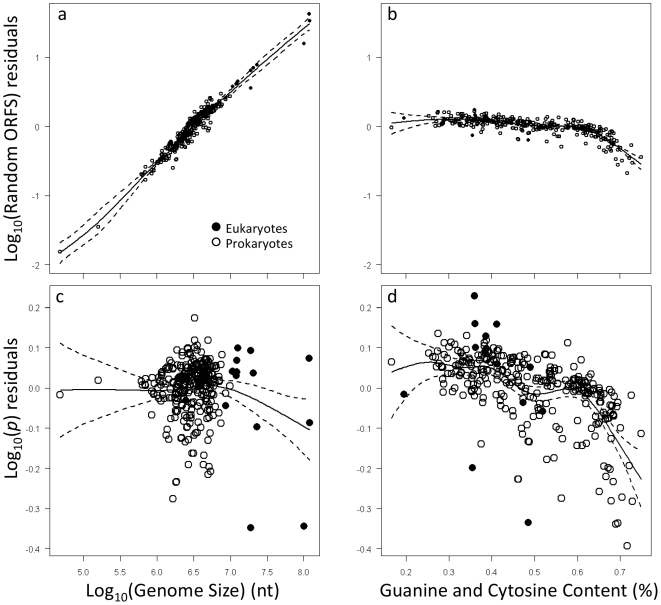
Similar articles
-
Predicting statistical properties of open reading frames in bacterial genomes.PLoS One. 2012;7(9):e45103. doi: 10.1371/journal.pone.0045103. Epub 2012 Sep 24. PLoS One. 2012. PMID: 23028785 Free PMC article.
-
GC content dependency of open reading frame prediction via stop codon frequencies.Gene. 2012 Dec 15;511(2):441-6. doi: 10.1016/j.gene.2012.09.031. Epub 2012 Sep 19. Gene. 2012. PMID: 23000023
-
Large-scale prokaryotic gene prediction and comparison to genome annotation.Bioinformatics. 2005 Dec 15;21(24):4322-9. doi: 10.1093/bioinformatics/bti701. Epub 2005 Oct 25. Bioinformatics. 2005. PMID: 16249266
-
Reconsidering proteomic diversity with functional investigation of small ORFs and alternative ORFs.Exp Cell Res. 2020 Aug 1;393(1):112057. doi: 10.1016/j.yexcr.2020.112057. Epub 2020 May 6. Exp Cell Res. 2020. PMID: 32387289 Review.
-
Small open reading frames and cellular stress responses.Mol Omics. 2019 Apr 1;15(2):108-116. doi: 10.1039/c8mo00283e. Epub 2019 Feb 27. Mol Omics. 2019. PMID: 30810554 Free PMC article. Review.
Cited by
-
Genome sizes and the Benford distribution.PLoS One. 2012;7(5):e36624. doi: 10.1371/journal.pone.0036624. Epub 2012 May 18. PLoS One. 2012. PMID: 22629319 Free PMC article.
-
Predicting statistical properties of open reading frames in bacterial genomes.PLoS One. 2012;7(9):e45103. doi: 10.1371/journal.pone.0045103. Epub 2012 Sep 24. PLoS One. 2012. PMID: 23028785 Free PMC article.
-
Alu distribution and mutation types of cancer genes.BMC Genomics. 2011 Mar 23;12:157. doi: 10.1186/1471-2164-12-157. BMC Genomics. 2011. PMID: 21429208 Free PMC article.
References
-
- Daubin V, Moran NA. Comment on “The origins of genome complexity”. Science. 2004;306(5698):978a. - PubMed
-
- Lynch M, Conery JS. The origins of genome complexity. Science. 2003;302(5649):1401–1404. - PubMed
-
- Lynch M, Conery JS. Response to comment on “The origins of genome complexity”. Science. 2004;306(5698):978. - PubMed
-
- Vinogradov AE, Lynch M, Conery JS. Testing genome complexity. Science. 2004;304(5669):389b–390. - PubMed
-
- Carpena P, Bernaola-Galván P, Román-Roldán R, Oliver JL. A simple and species-independent coding measure. Gene. 2002;300(1–2):97–104. - PubMed
MeSH terms
LinkOut - more resources
Full Text Sources
Miscellaneous
