

Automatic multiple-zone rigid-body refinement with a large convergence radius
- PMID: 19649324
- PMCID: PMC2712840
- DOI: 10.1107/S0021889809023528
Automatic multiple-zone rigid-body refinement with a large convergence radius
Abstract
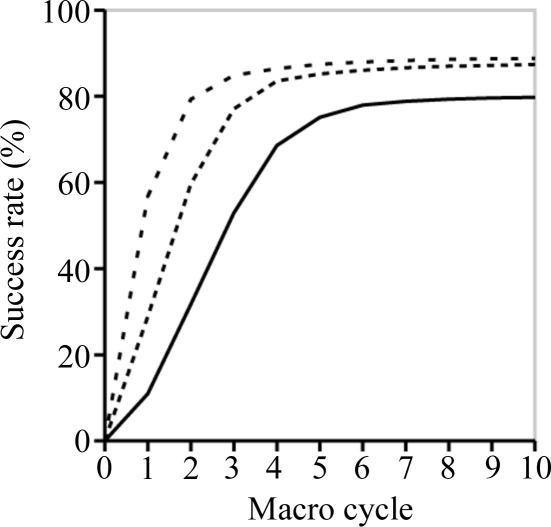
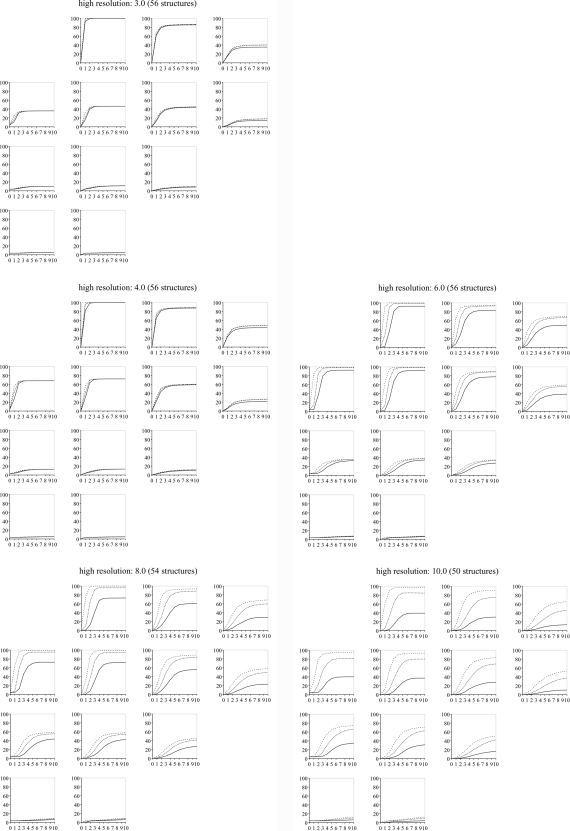
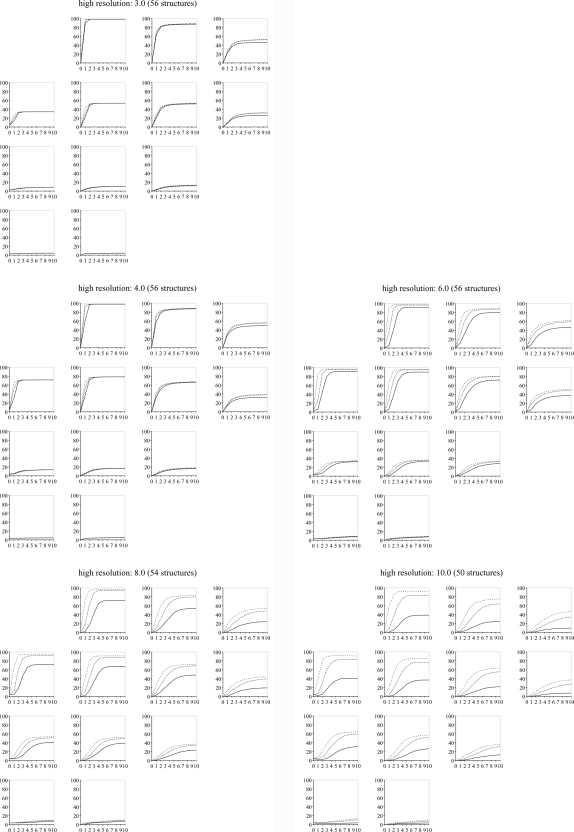
Rigid-body refinement is the constrained coordinate refinement of one or more groups of atoms that each move (rotate and translate) as a single body. The goal of this work was to establish an automatic procedure for rigid-body refinement which implements a practical compromise between runtime requirements and convergence radius. This has been achieved by analysis of a large number of trial refinements for 12 classes of random rigid-body displacements (that differ in magnitude of introduced errors), using both least-squares and maximum-likelihood target functions. The results of these tests led to a multiple-zone protocol. The final parameterization of this protocol was optimized empirically on the basis of a second large set of test refinements. This multiple-zone protocol is implemented as part of the phenix.refine program.
Figures
References
-
- Adams, P. D., Grosse-Kunstleve, R. W., Hung, L.-W., Ioerger, T. R., McCoy, A. J., Moriarty, N. W., Read, R. J., Sacchettini, J. C., Sauter, N. K. & Terwilliger, T. C. (2002). Acta Cryst. D58, 1948–1954. - PubMed
-
- Afonine, P. V., Grosse-Kunstleve, R. W. & Adams, P. D. (2005b). CCP4 Newsletter No. 42, http://www.ccp4.ac.uk/newsletters/newsletter42/content.html.
-
- Afonine, P. V., Lunin, V. Y., Muzet, N. & Urzhumtsev, A. (2004). Acta Cryst. D60, 260–274. - PubMed
Grants and funding
LinkOut - more resources
Full Text Sources