

Importance of shrinkage in empirical bayes estimates for diagnostics: problems and solutions
- PMID: 19649712
- PMCID: PMC2758126
- DOI: 10.1208/s12248-009-9133-0
Importance of shrinkage in empirical bayes estimates for diagnostics: problems and solutions
Abstract
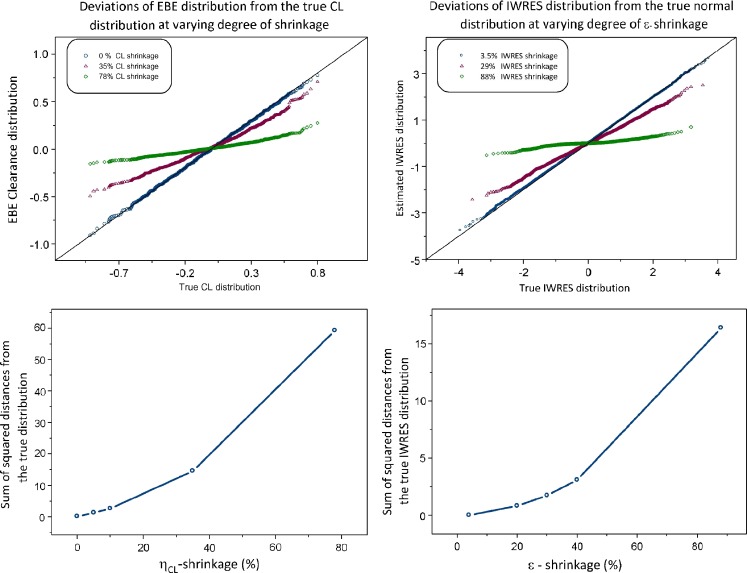
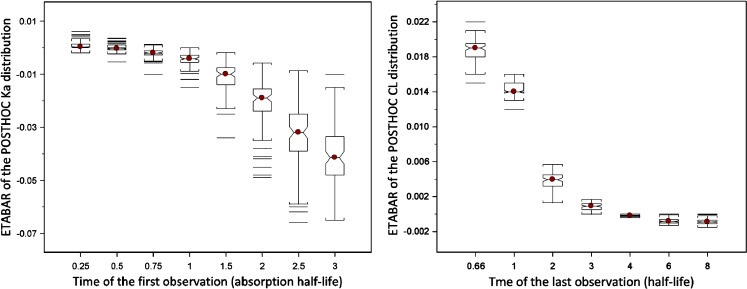
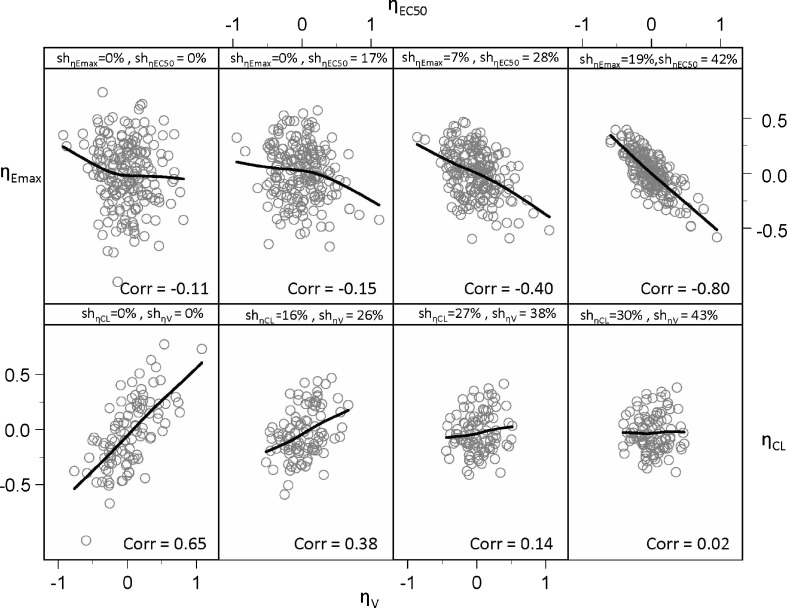
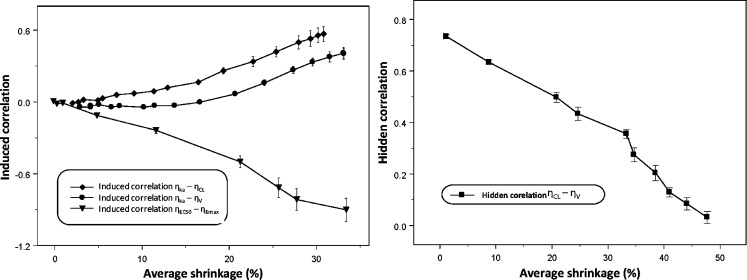
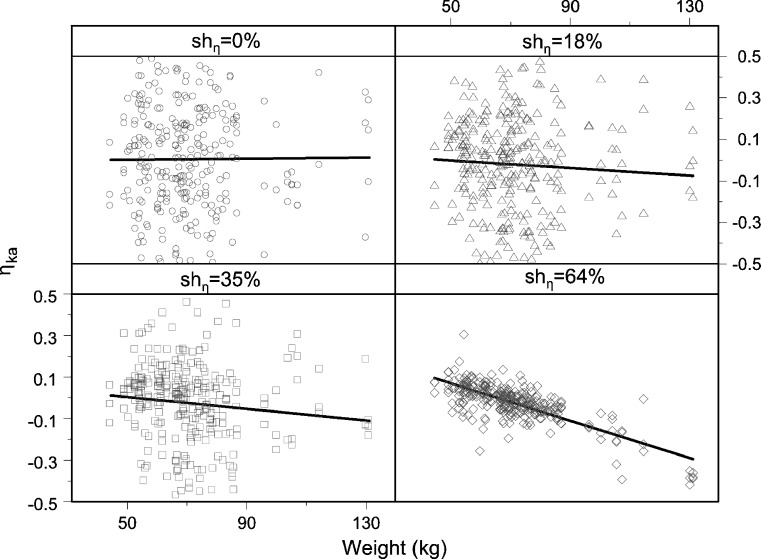
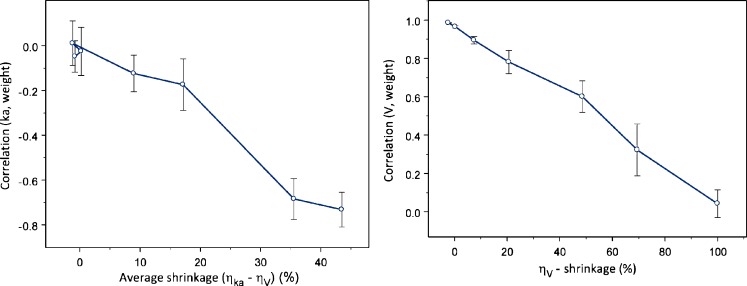
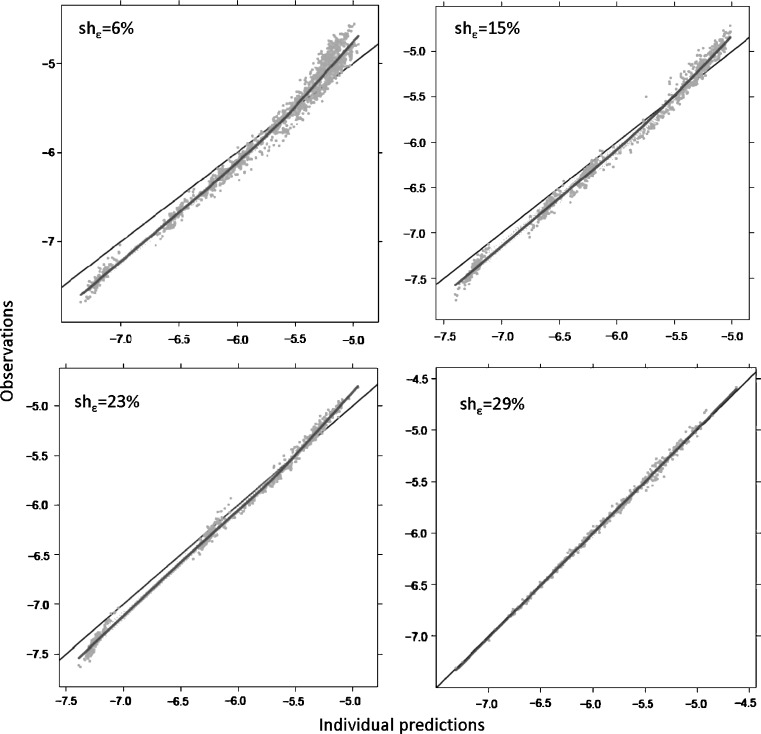
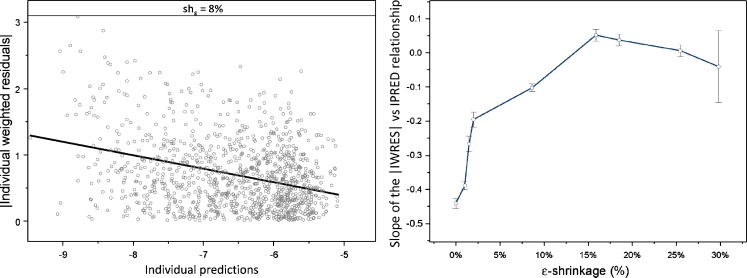
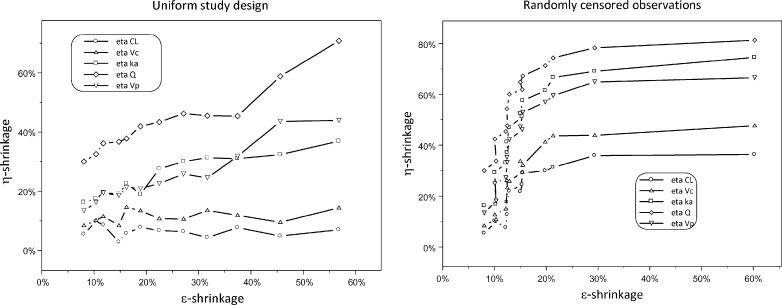
Empirical Bayes ("post hoc") estimates (EBEs) of etas provide modelers with diagnostics: the EBEs themselves, individual prediction (IPRED), and residual errors (individual weighted residual (IWRES)). When data are uninformative at the individual level, the EBE distribution will shrink towards zero (eta-shrinkage, quantified as 1-SD(eta (EBE))/omega), IPREDs towards the corresponding observations, and IWRES towards zero (epsilon-shrinkage, quantified as 1-SD(IWRES)). These diagnostics are widely used in pharmacokinetic (PK) pharmacodynamic (PD) modeling; we investigate here their usefulness in the presence of shrinkage. Datasets were simulated from a range of PK PD models, EBEs estimated in non-linear mixed effects modeling based on the true or a misspecified model, and desired diagnostics evaluated both qualitatively and quantitatively. Identified consequences of eta-shrinkage on EBE-based model diagnostics include non-normal and/or asymmetric distribution of EBEs with their mean values ("ETABAR") significantly different from zero, even for a correctly specified model; EBE-EBE correlations and covariate relationships may be masked, falsely induced, or the shape of the true relationship distorted. Consequences of epsilon-shrinkage included low power of IPRED and IWRES to diagnose structural and residual error model misspecification, respectively. EBE-based diagnostics should be interpreted with caution whenever substantial eta- or epsilon-shrinkage exists (usually greater than 20% to 30%). Reporting the magnitude of eta- and epsilon-shrinkage will facilitate the informed use and interpretation of EBE-based diagnostics.
Figures
Similar articles
-
Further Evaluation of Covariate Analysis using Empirical Bayes Estimates in Population Pharmacokinetics: the Perception of Shrinkage and Likelihood Ratio Test.AAPS J. 2017 Jan;19(1):264-273. doi: 10.1208/s12248-016-0001-4. Epub 2016 Oct 19. AAPS J. 2017. PMID: 27761720
-
Shrinkage in nonlinear mixed-effects population models: quantification, influencing factors, and impact.AAPS J. 2012 Dec;14(4):927-36. doi: 10.1208/s12248-012-9407-9. Epub 2012 Sep 20. AAPS J. 2012. PMID: 22993107 Free PMC article.
-
Covariates in Pharmacometric Repeated Time-to-Event Models: Old and New (Pre)Selection Tools.AAPS J. 2018 Dec 18;21(1):11. doi: 10.1208/s12248-018-0278-6. AAPS J. 2018. PMID: 30565031
-
"De-Shrinking" EBEs: The Solution for Bayesian Therapeutic Drug Monitoring.Clin Pharmacokinet. 2022 May;61(5):749-757. doi: 10.1007/s40262-021-01105-y. Epub 2022 Feb 4. Clin Pharmacokinet. 2022. PMID: 35119624 Free PMC article.
-
Empirical Bayes methods for stabilizing incidence rates before mapping.Epidemiology. 1994 Nov;5(6):622-30. doi: 10.1097/00001648-199411000-00010. Epidemiology. 1994. PMID: 7841244 Review.
Cited by
-
Population pharmacokinetics of mycophenolate mofetil in pediatric patients early after liver transplantation.Front Pharmacol. 2022 Oct 13;13:1002628. doi: 10.3389/fphar.2022.1002628. eCollection 2022. Front Pharmacol. 2022. PMID: 36313303 Free PMC article.
-
Item Response Theory Modeling of the International Prostate Symptom Score in Patients with Lower Urinary Tract Symptoms Associated with Benign Prostatic Hyperplasia.AAPS J. 2020 Aug 27;22(5):115. doi: 10.1208/s12248-020-00500-w. AAPS J. 2020. PMID: 32856168 Free PMC article.
-
A population pharmacokinetic model for perioperative dosing of factor VIII in hemophilia A patients.Haematologica. 2016 Oct;101(10):1159-1169. doi: 10.3324/haematol.2015.136275. Epub 2016 Jul 6. Haematologica. 2016. PMID: 27390359 Free PMC article.
-
Model-informed dose optimization of mycophenolic acid in pediatric kidney transplant patients.Eur J Clin Pharmacol. 2024 Nov;80(11):1761-1771. doi: 10.1007/s00228-024-03743-0. Epub 2024 Aug 17. Eur J Clin Pharmacol. 2024. PMID: 39153087 Free PMC article.
-
Amisulpride: Real-World Evidence of Dose Adaptation and Effect on Prolactin Concentrations and Body Weight Gain by Pharmacokinetic/Pharmacodynamic Analyses.Clin Pharmacokinet. 2020 Mar;59(3):371-382. doi: 10.1007/s40262-019-00821-w. Clin Pharmacokinet. 2020. PMID: 31552612
References
-
- Williams PJ, Ette EI, editors. Pharmacometrics: the science of quantitative pharmacology. New York: Wiley; 2007.
-
- FDA . Guidance for industry, population pharmacokinetics. Washington, DC: US Department of Health and Human Services; 1999.
MeSH terms
LinkOut - more resources
Full Text Sources
Other Literature Sources
