. 2009 Aug 5;97(3):777-86.
doi: 10.1016/j.bpj.2009.05.017.

X-ray diffraction and reflectivity validation of the depletion attraction in the competitive adsorption of lung surfactant and albumin

Affiliations

X-ray diffraction and reflectivity validation of the depletion attraction in the competitive adsorption of lung surfactant and albumin

Patrick C Stenger et al. Biophys J. .

Abstract

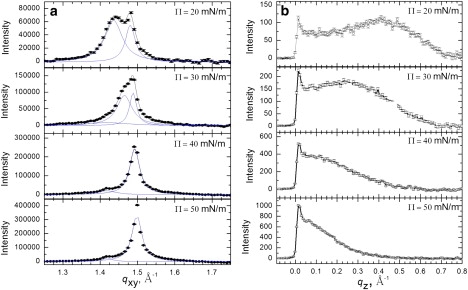
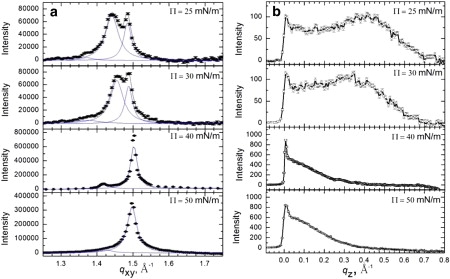
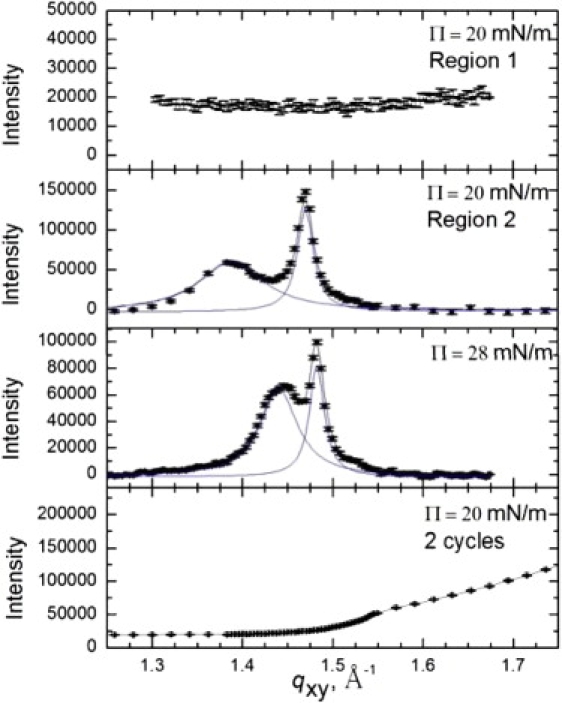
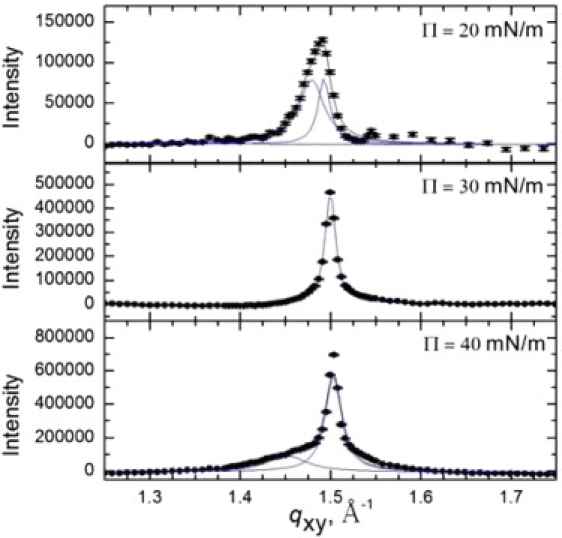
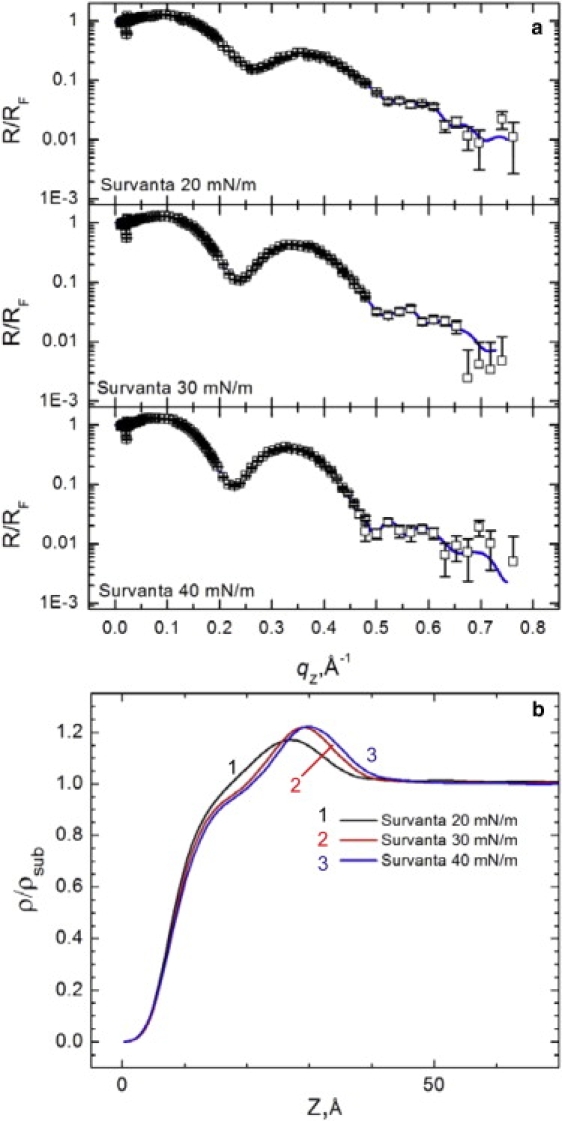
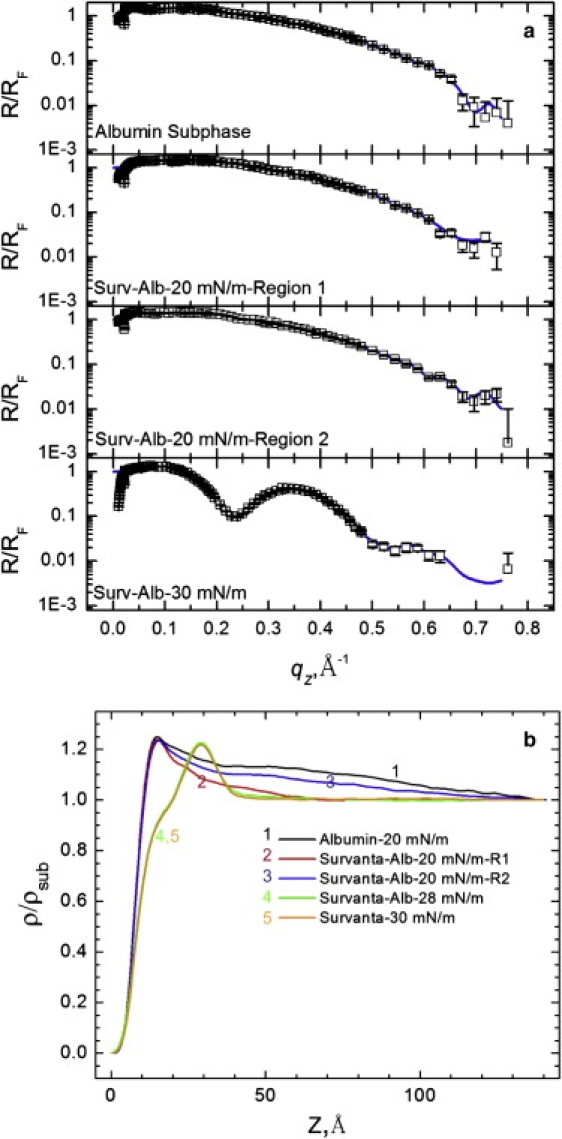
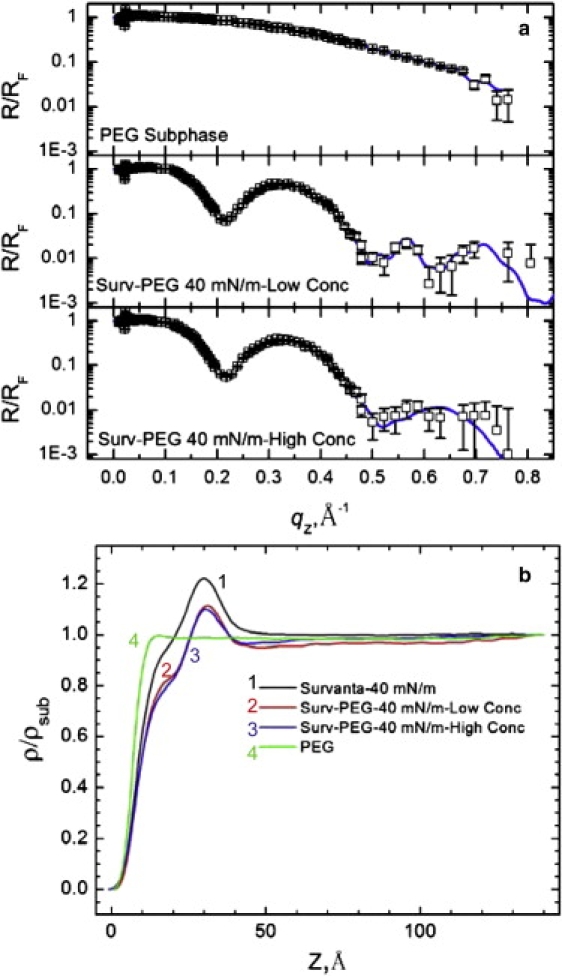
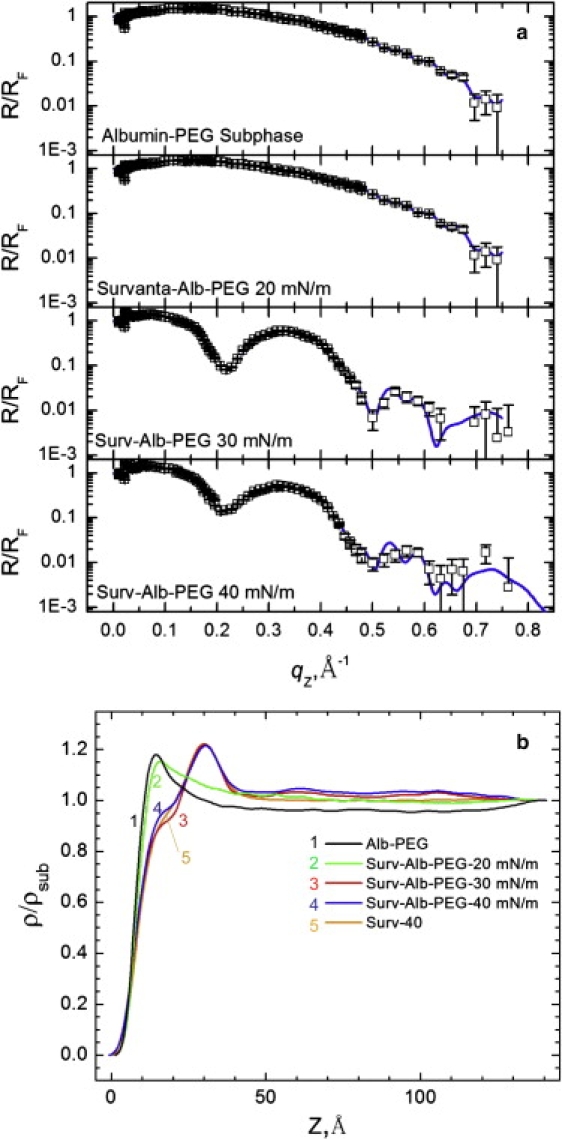
Lung surfactant (LS) and albumin compete for the air-water interface when both are present in solution. Equilibrium favors LS because it has a lower equilibrium surface pressure, but the smaller albumin is kinetically favored by faster diffusion. Albumin at the interface creates an energy barrier to subsequent LS adsorption that can be overcome by the depletion attraction induced by polyethylene glycol (PEG) in solution. A combination of grazing incidence x-ray diffraction (GIXD), x-ray reflectivity (XR), and pressure-area isotherms provides molecular-resolution information on the location and configuration of LS, albumin, and polymer. XR shows an average electron density similar to that of albumin at low surface pressures, whereas GIXD shows a heterogeneous interface with coexisting LS and albumin domains at higher surface pressures. Albumin induces a slightly larger lattice spacing and greater molecular tilt, similar in effect to a small decrease in the surface pressure. XR shows that adding PEG to the LS-albumin subphase restores the characteristic LS electron density profile at the interface, and confirms that PEG is depleted near the interface. GIXD shows the same LS Bragg peaks and Bragg rods as on a pristine interface, but with a more compact lattice corresponding to a small increase in the surface pressure. These results confirm that albumin adsorption creates a physical barrier that inhibits LS adsorption, and that PEG in the subphase generates a depletion attraction between the LS aggregates and the interface that enhances LS adsorption without substantially altering the structure or properties of the LS monolayer.


Figures

Figure 1
Figure 1
Bragg peaks and rods from GIXD of 200 μg Survanta spread onto a saline buffer subphase. (a) Bragg peaks at 20–50 mN/m. (b) Bragg rods at 20–50 mN/m.
Figure 2
Figure 2
Bragg peaks and rods from GIXD of 200 μg Survanta spread onto a saline buffer subphase containing 5% wt. PEG. (a) Bragg peaks at 25–50 mN/m (The minimum surface pressure was ∼25 mN/m on the PEG subphase. (b) Bragg rods at 25–50 mN/m. Both the Bragg peaks and rods are similar to those of Survanta on the control subphase.
Figure 3
Figure 3
Bragg peaks from GIXD of 600 μg Survanta spread onto a saline buffer subphase containing 2 mg/mL albumin. The first two panels show different regions of the film at the same surface pressure. The top panel shows no Bragg peaks in region 1, consistent with an albumin-covered interface. The second panel shows that in the adjacent region (region 2), Bragg peaks reveal the presence of Survanta. The third panel shows that the Survanta lattice compacts with increasing surface pressure; however, surface pressures higher than 28 mN/m could be sustained due to the presence of albumin. The last panel shows GIXD at 20 mN/m after two additional cycles; the Survanta peaks are no longer present.
Figure 4
Figure 4
Bragg peaks from GIXD of 600 μg Survanta spread onto a subphase containing 2 mg/mL albumin and 5% wt. PEG at 20–40 mN/m. The packing changes from distorted hexagonal to hexagonal at a lower surface pressure than Survanta on the control subphase. The hexagonal lattice with zero tilt occurs at a lower surface pressure than on the control subphase (Fig. 1).
Figure 5
Figure 5
(a) XR for 200 μg Survanta spread on the control subphase. The blue lines are fits to the data using a model-independent algorithm as discussed in the text. (b) The electron density profiles, normalized by the subphase electron density, for the corresponding XR data. With increasing surface pressure, the headgroup maximum increases, the width of the headgroup region decreases, and the location of the headgroup maximum shifts to the right.
Figure 6
Figure 6
(a) XR for 600 μg Survanta spread on a saline buffer subphase containing 2 mg/mL albumin. No Survanta is present for the albumin subphase data. Regions 1 and 2 are the same areas used for the GIXD in Fig. 4. (b) The electron density profiles, normalized by the subphase electron density. For Survanta-albumin-20 mN/m, the electron density profile is similar to that of albumin for both regions 1 and 2, whereas at 28 mN/m the electron density profile is similar to that of Survanta (Fig. 6).
Figure 7
Figure 7
(a) XR for 200 μg and 600 μg of Survanta spread on a saline buffer subphase containing 5% wt. PEG at 40 mN/m. No Survanta is present for the PEG subphase data. (b) The electron density profiles, normalized by the subphase electron density. The two Survanta concentrations result in nearly identical density profiles. The electron density profile of 200 μg Survanta on the control subphase at 40 mN/m is shown for comparison.
Figure 8
Figure 8
(a) XR for 600 μg Survanta spread on a subphase containing 2 mg/mL albumin and 5% wt. PEG. No Survanta is present for the albumin-PEG subphase data. (b) The electron density profiles normalized by the subphase electron density. At 20 mN/m, the electron density profile is similar to that of albumin, whereas for 30 and 40 mN/m, the electron density is similar to that of Survanta, indicating that Survanta has displaced the albumin. The electron density profile of 200 μg Survanta on the control subphase at 40 mN/m is shown for comparison.

Similar articles

Cited by

References

    1. Marsh D. Lateral pressure in membranes. Biochim. Biophys. Acta. 1996;1286:183–223. - PubMed
    1. Taeusch H.W., Bernadino de la Serna J., Perez-Gil J., Alonso C., Zasadzinski J.A. Inactivation of pulmonary surfactant due to serum-inhibited adsorption and reversal by hydrophilic polymers: experimental. Biophys. J. 2005;89:1769–1779. - PMC - PubMed
    1. Warriner H.E., Ding J., Waring A.J., Zasadzinski J.A. A concentration-dependent mechanism by which serum albumin inactivates replacement lung surfactants. Biophys. J. 2002;82:835–842. - PMC - PubMed
    1. Zasadzinski J.A., Alig T.F., Alonso C., Bernadino de la Serna J., Perez-Gil J. Inhibition of pulmonary surfactant adsorption by serum and the mechanisms of reversal by hydrophilic polymers: theory. Biophys. J. 2005;89:1621–1629. - PMC - PubMed
    1. Stenger P.C., Palazolgu O., Zasadzinski J.A. Mechanisms of polyelectrolyte enhanced surfactant adsorption at the air-water interface. Biochim. Biophys. Acta. 2009;1788:1033–1043. - PMC - PubMed

Publication types

LinkOut - more resources