. 2009 Dec;45(6):1104-16.
doi: 10.1016/j.bone.2009.07.078. Epub 2009 Aug 6.

Beam hardening artifacts in micro-computed tomography scanning can be reduced by X-ray beam filtration and the resulting images can be used to accurately measure BMD

Affiliations

Beam hardening artifacts in micro-computed tomography scanning can be reduced by X-ray beam filtration and the resulting images can be used to accurately measure BMD

Jeffrey A Meganck et al. Bone. 2009 Dec.

Abstract

Bone mineral density (BMD) measurements are critical in many research studies investigating skeletal integrity. For pre-clinical research, micro-computed tomography (microCT) has become an essential tool in these studies. However, the ability to measure the BMD directly from microCT images can be biased by artifacts, such as beam hardening, in the image. This three-part study was designed to understand how the image acquisition process can affect the resulting BMD measurements and to verify that the BMD measurements are accurate. In the first part of this study, the effect of beam hardening-induced cupping artifacts on BMD measurements was examined. In the second part of this study, the number of bones in the X-ray path and the sampling process during scanning was examined. In the third part of this study, microCT-based BMD measurements were compared with ash weights to verify the accuracy of the measurements. The results indicate that beam hardening artifacts of up to 32.6% can occur in sample sizes of interest in studies investigating mineralized tissue and affect mineral density measurements. Beam filtration can be used to minimize these artifacts. The results also indicate that, for murine femora, the scan setup can impact densitometry measurements for both cortical and trabecular bone and morphologic measurements of trabecular bone. Last, when a scan setup that minimized all of these artifacts was used, the microCT-based measurements correlated well with ash weight measurements (R(2)=0.983 when air was excluded), indicating that microCT can be an accurate tool for murine bone densitometry.


Figures

Figure 1
Figure 1. Phantom design for beam hardening assessments
This schematic demonstrates the design for the phantom that was used to assess beam hardening. There are 11 different thicknesses (see Table 2 for dimensions) that are circular in shape.
Figure 2
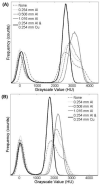
Figure 2. Extensive beam filtration results in a decrease in contrast
Histograms for Tier 11 in the phantoms made from (A) SB3 and (B) CB2-50% when scanned without the flattener. In all cases, the peak centered around the value of 0 represents water in the background of the image. The use of the 0.254 mm Al/0.254 mm Cu filter resulted in a shift downward in the voxel HU values, indicating less contrast in these images. When beam hardening was present, as seen most severely for the data obtained with no filtration, there was an alteration in the shape of the histogram peak for the phantom. Thresholds were also chosen based on these histograms. For SB3, the values 2200-3200 HU were used for the 0.254 mm Al/0.254 mm Cu filter and the values 2000-4300 were used for all other filters. For CB2-50%, the values 1100-2400 HU were used for the 0.254 mm Al/0.254 mm Cu filter and the values 1600-3200HU were used for all other filters.
Figure 3
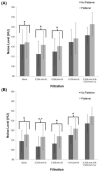
Figure 3. Noise levels increased with extensive beam filtration and use of a beam flattener
Mean noise levels for water adjacent to the tiered phantoms made from (A) SB3 and (B) CB2-50%. ANOVA analyses indicated that use of a beam flattener results in an increase in the noise level. In addition to this, filtration also affected the baseline noise level. * indicates significance in comparison to the the 0.254 mm Al/0.254 mm Cu filter and + indicates significance in comparison to the 1.016 mm Al filter. Data are presented as the mean ± one standard deviation.
Figure 4
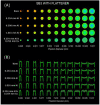
Figure 4. Beam hardening artifacts are worse with less filtration and the severity increases with sample thickness
These plots visually demonstrate the distribution in voxel grayscale values for the phantom composed of SB3 when scanned with the acrylic beam flattener. (A) A colormapped version for each of the images represents the grayscale values, so a change in the color pattern indicates an apparent change in the voxel HU value. The lack of color change for the bottom row, which is the data for the most beam filtration, indicates that the beam hardening artifacts are minimized. To see this cupping more clearly, (B) a line was plotted across the center of each image. A different range of grayscale values was used to visualize the data for the 0.254 mm Al/0.254 mm Cu filter in comparison to the data for all other filters due to a contrast decrease (Figure 3).
Figure 5
Figure 5. The measured tissue mineral density decreases with specimen thickness due to beam hardening artifacts
Results of the TMD quantification for (A) the SB3 phantom scanned with the flattener, (B) the SB3 phantom scanned without the flattener, (C) the CB2-50% phantom scanned with the flattener, and (D) the CB2-50% phantom without the flattener. The theoretical `ideal' value for the TMD of each material is superimposed as a dashed line. The measured TMD decreases as the amount of beam hardening induced cupping artifacts increases.
Figure 6
Figure 6. The scan setup can affect bone densitometry and trabecular morphology measurements
Comparisons of measurements on murine cortical bone for the (A) TMC of diaphyseal cortical bone, (B) TMD of diaphyseal cortical bone, (C) TMC of trabecular bone, (D) TMD of trabecular bone and (E) bone volume fraction of the trabecular bone. The results are presented as paired comparisons to the scanning condition where each bone was scanned individually over 360°. An asterisk indicates a statistically significant difference (p<0.05 unless indicated).
Figure 7
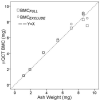
Figure 7. μCT accurately predicts specimen ash weight
Vertebrae from mice spanning 1 to 12 months of age were scanned by μQCT and analyzed for total bone mineral content using the full range of voxel values (BMCfull, squares) and a limited set of voxels (BMCexclude, circles), excluding values less than -500. Vertebrae were subsequently ashed, and ash weight values were compared to μQCT. BMCfull and BMCexclude correlated linearly with BMCash, with near 1:1 correlation (slope +/- 95% CI: BMCexclude vs. BMCash 0.9897 ± .1284; BMCfull vs. BMCash 1.0538 ± 0.2183) indicating μQCT is an accurate technique for measuring specimen ash weight.

References

    1. Blake GM, Fogelman I. Methods and Clinical Issues in Bone Densitometry and Quantitative Ultrasonometry. In: Bilezikian JP, Raisz LG, Rodan GA, editors. Principles of Bone Biology. 2nd ed. Academic Press; San Diego: 2002. pp. 1573–1585.
    1. Genant HK, Faulkner KG, Gluer CC, Engelke K. Bone densitometry: current assessment. Osteoporos Int. 1993;3(Suppl 1):91–7. - PubMed
    1. Bolotin HH. DXA in vivo BMD methodology: An erroneous and misleading research and clinical gauge of bone mineral status, bone fragility, and bone remodelling. Bone. 2007;41:138–54. - PubMed
    1. Martin DE, Severns AE, Kabo JM. Determination of mechanical stiffness of bone by pQCT measurements: correlation with non-destructive mechanical four-point bending test data. J Biomech. 2004;37:1289–93. - PubMed
    1. Lochmuller EM, Lill CA, Kuhn V, Schneider E, Eckstein F. Radius bone strength in bending, compression, and falling and its correlation with clinical densitometry at multiple sites. J Bone Miner Res. 2002;17:1629–38. - PubMed

Publication types