. 2009 Oct;30(10):1686-95.
doi: 10.1093/carcin/bgp192. Epub 2009 Aug 3.

Intercellular communication of cellular stress monitored by gamma-H2AX induction

Affiliations

Intercellular communication of cellular stress monitored by gamma-H2AX induction

Jennifer S Dickey et al. Carcinogenesis. 2009 Oct.

Abstract

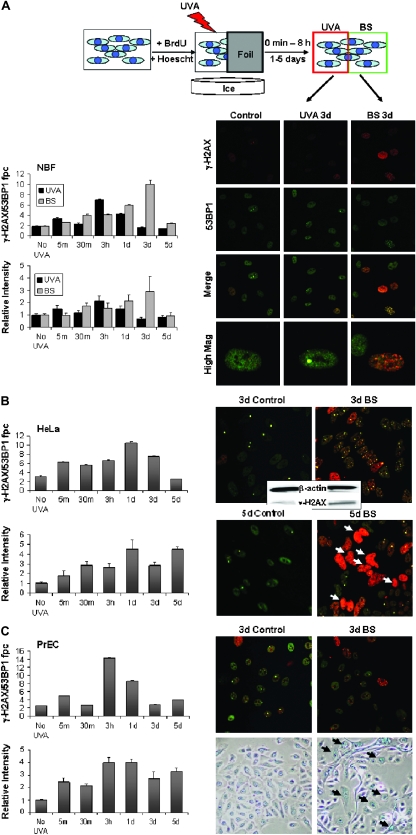
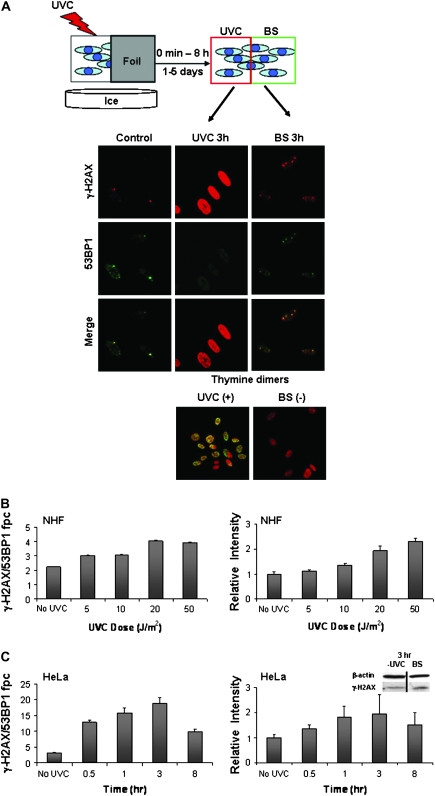
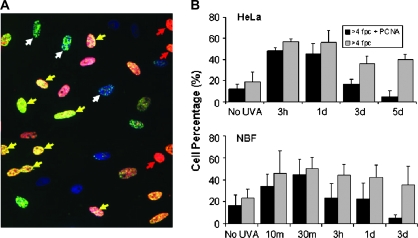
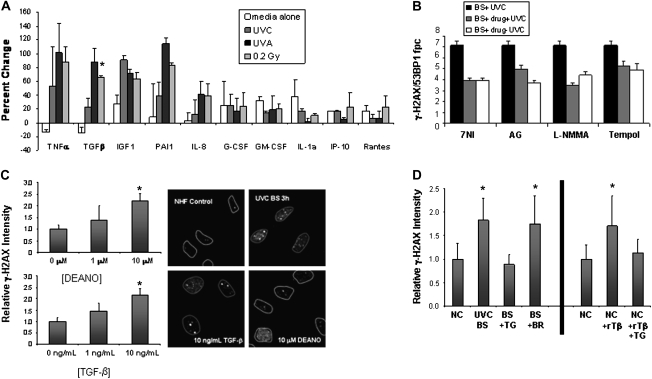
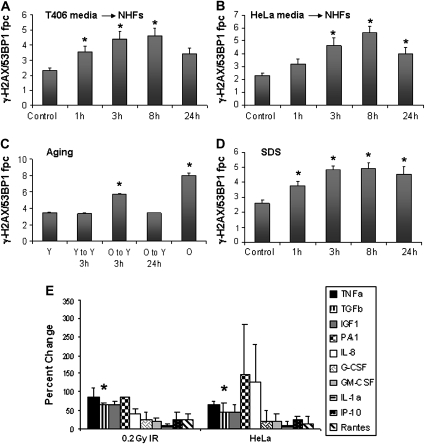
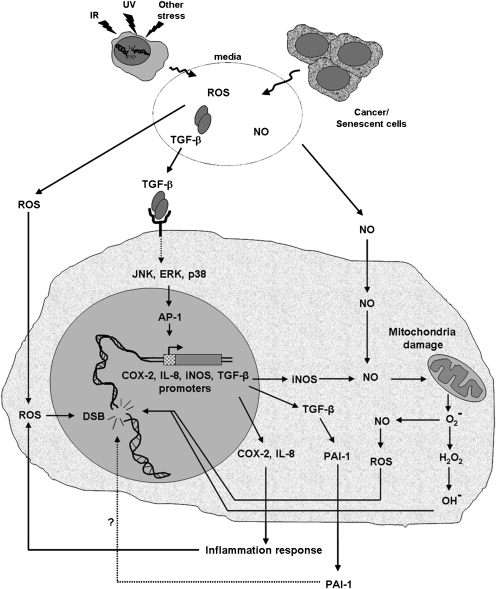
When cells are exposed to ionizing radiation (IR), unexposed cells that share media with damaged cells exhibit similar effects to irradiated cells including increased levels of DNA double-strand breaks (DSBs). Hypothesizing that this effect, known as the radiation-induced bystander effect, may be a specific instance of communication between damaged and undamaged cells regardless of damage source, we demonstrated that exposure of target cells to non-IR induces bystander damage in non-targeted cells as measured by gamma-H2AX and 53BP1 focal formation. Initially, bystander damage was found primarily in S-phase cells, but at later times, non-S-phase cells were also affected. In addition, media from undamaged malignant and senescent cells also was found to induce DSBs in primary cultures. Media conditioned on cells targeted with either ionizing or non-IR as well as on undamaged malignant and senescent cells contained elevated levels of several cytokines. One of these, transforming growth factor beta (TGF-beta), and nitric oxide (NO) were found to elevate numbers of gamma-H2AX/53BP1 foci in normal cell cultures similar to levels found in bystander cells, and this elevation was abrogated by NO synthase inhibitors, TGF-beta blocking antibody and antioxidants. These findings support the hypothesis that damage in bystander cells results from their exposure to cytokines or reactive compounds released from stressed cells, regardless of damage source. These results have implications for oncogenesis in that they indicate that damaged normal cells or undamaged tumor cells may induce genomic instability, leading to an increased risk of oncogenic transformation in other cells with which they share media or contact directly.


Figures

Fig. 1.
Fig. 1.
Exposure of sensitized cells to UVA light induces bystander responses in shielded cells. (A) Schematic: cell cultures containing BrdU and Hoechst 3342 were irradiated with 0.04 J/cm2 UVA with half the culture shielded with foil. After incubation for various periods, foci containing γ-H2AX and 53BP1 were counted in directly exposed and shielded bystander (BS) cells. Total γ-H2AX intensity was also measured. Shown are representative images of NBF cultures taken 3 days after sham exposure (control, left column), direct exposure (UVA 3d, middle column) or shielded from exposure (BS 3d, right column). Cells were stained for γ-H2AX (red, top row) and 53BP1 (green, second row). Merged images (bottom rows) reveal foci double positive for the two proteins. The graphs show values of colocalized γ-H2AX/53BP1 foci (top left) or total nuclear γ-H2AX intensity (bottom left) per cell for directly irradiated (black bars) and bystander (gray bars) cells at various times post-exposure. Increases in γ-H2AX foci numbers and intensity were statistically significant at 3 h and 1 day in directly exposed cells and from 30 min to 3 days in bystander populations. (B) UVA protocol with HeLa cell cultures. Representative images (see panel A) of HeLa control (sham exposed) and bystander cultures taken 3 and 5 days after exposure. Apoptotic nuclei are indicated by white arrows. Immunoblot analysis of control and bystander HeLa cultures 3 days after exposure is shown in the middle inset. The graphs show values of colocalized γ-H2AX/53BP1 foci (top left) or total nuclear γ-H2AX intensity (bottom left) per cell for bystander (gray bars) cells at various times post-exposure. Results were statistically significant for all time points with the exception of 5 days post-exposure in the top left graph. (C) UVA protocol with PrEC cultures. Representative images of PrEC control and bystander cultures taken 3 days post-exposure stained for γ-H2AX and 53BP1 (top) or senescence-associated beta-galactosidase, a marker of cellular senescence (bottom). The graphs show values of colocalized γ-H2AX/53BP1 foci (top left) or total nuclear γ-H2AX intensity (bottom left) per cell for bystander (gray bars) cells at various times post-exposure. Results were statistically significant at all time points in intensity measurements and at the 5 min, 3 h, 1 day and 5 day time points in focal counting. Error bars in all graphs indicate the SEM for at least 100 cells.
Fig. 2.
Fig. 2.
UVC-induced DNA damage generates bystander responses. (A) Schematic: cells were exposed to UVC with half shielded with foil. After incubation, DNA DSBs were assessed in control, irradiated and bystander (BS) cell populations as above. Images are representative of NHF cell cultures 3 h after sham treatment (left column, control), direct exposure to 100 J/m2 UVC (middle column) or shielding (right column). Cultures were stained for γ-H2AX (red, top row) and 53BP1 (green, second row). Merged images (third row) exhibit yellow foci where the two proteins colocalize. The bottom row images show cells stained for thymine dimers (green) and DNA (red, propidium iodide). UVC-induced photo products are present only in exposed cells. (B) Quantification of γ-H2AX induced in NHF bystander cell populations 3 h after various doses of UVC. Colocalized γ-H2AX and 53BP1 fpc (left) and γ-H2AX intensity (right) are shown. Differences in γ-H2AX foci numbers were statistically significant at all doses tested, whereas differences in intensity were significant at the 20 and 50 J/m2 doses. (C) Quantification of γ-H2AX induced in bystander HeLa cell populations various times after 6000 J/m2 UVC exposure. Colocalized γ-H2AX and 53BP1 fpc (left) and γ-H2AX intensity (right) are shown. All time points tested were significantly different from control levels in both systems. The inset shows immunoblot analysis of control and bystander populations 3 h after irradiation.
Fig. 3.
Fig. 3.
The role of cell cycle in the bystander effect. (A) Image of HeLa bystander cells 3 h after neighboring cell exposure to UVA in the presence of BrdU and Hoechst. γ-H2AX is green, PCNA is red and DNA is blue. Arrows: yellow, cells positive for both γ-H2AX and PCNA; red, cells negative for γ-H2AX and positive for PCNA; white, cells positive for γ-H2AX and negative for PCNA. (B) Percentage of bystander cells with >4 γ-H2AX fpc (gray bars) and those cells that were also PCNA positive (black bars) in HeLa (top) and NBF (bottom) cultures. Differences from controls in percentage of cells with >4 fpc were significant at all time points, and differences in the ratio of PCNA-positive versus -negative cells that had >4 fpc were significant at the 3 day and 5 day time points.
Fig. 4.
Fig. 4.
Cytokines and reactive oxygen species in the bystander effect. (A) Cytokines released by damaged cells. Protein levels are compared with the those present in media conditioned on undamaged NHFs. Media-alone (white bars) samples were not conditioned on cells. UVC samples (dark gray) were exposed to 6000 J/m2 UVC, UVA samples (black bars) were exposed to 0.04 J/m2 UVA after sensitization with BrdU and Hoechst, 0.2 Gy samples (light gray) were exposed to 0.2 Gy IR. All samples were collected 3 h after exposure. Error bars are the standard deviation for two independent experiments performed 1 week apart. (B) Effect of reactive oxygen species and NO modulators on the bystander effect in UVC-irradiated NHFs by media transfer. Colocalized γ-H2AX/53BP1 fpc were measured for bystander (BS) cells in media from NHF cultures that received UVC alone (black), UVC and inhibitor (gray) and bystander cells that received inhibitor alone (white). Inhibitors used were the nitric oxide synthase inhibitors 7-NI, AG and L-NMMA as well as the antioxidant tempol. (C) NO and TGF-β can each induce γ-H2AX in otherwise undamaged cells. Various concentrations of diethylamine NONOate, which produces NO (top) or TGF-β (bottom), were incubated with NHFs for 3 h before cells were fixed and analyzed for changes in γ-H2AX relative intensity. The image on the right depicts γ-H2AX formation in undamaged NHFs (top left), in NHF bystander cells 3 h after neighboring cells were exposed to 6000 J/m2 UVC (top right), NHFs 3 h after exposure to 10 ng/ml TGF-β (bottom left) or 10 μM diethylamine NONOate (bottom right). (D, left) The relative γ-H2AX intensity in NHF bystander cells 3 h after UVC exposure without blocking antibody (UVC BS), with a TGF-β blocking antibody (BS + TG) and with a non-specific BrdU antibody (BS + BR). NC denotes normal control NHFs (set to 1.0). (D, right) Normal control cells incubated alone (NC), with recombinant TGF-β protein (NC + rTβ) or with recombinant TGF-β protein plus the blocking TGF-β antibody (NC + rTβ + TG). Data are from at least 100 cells in at least three separate fields. Asterisks in A, C and D indicate significant changes over control values. All compounds shown in (B) significantly reduced the numbers of fpc in bystander cells.
Fig. 5.
Fig. 5.
Undamaged tumor and senescent cells generate a bystander response. Colocalized γ-H2AX/53BP1 fpc were measured for NHFs incubated in media transferred from T406 glioma (A) or HeLa cell cultures (B). (C) Colocalized γ-H2AX/53BP1 fpc in early- (Y) and late-passage NHF cultures (O) and early-passage NHFs incubated in media transferred from early- (Y to Y) or late-passage (O to Y) NHFs. (D) Colocalized γ-H2AX/53BP1 fpc were measured for NHFs incubated in the presence of 0.1 mg/ml SDS over time. Error bars in (A–D) represent the SEM for at least 100 cells. (E) Tumor cells release cytokines similar to those from damaged primary cells. Media from NHFs exposed to 0.2 Gy IR was compared with that conditioned on undamaged HeLa cells. All media samples were collected 3 h after damage or after 3 h of media conditioning. Error bars are the standard deviation for two independent experiments performed 1 week apart. Asterisks in (A–E) represent statistically significant changes from control values.
Fig. 6.
Fig. 6.
Model of the bystander stress response. IR, UV rays and stress can all cause DNA damage in cells. This DNA damage or the genomic instability present in tumors leads to the production of reactive oxygen species, NO and TGF-β. All of which could serve to induce a bystander effect in neighboring cell populations. The vulnerable bystander cells display increases in genomic instability, which can be monitored with antibodies to γ-H2AX and other DNA damage proteins.

References

    1. Nagasawa H, et al. Induction of sister chromatid exchanges by extremely low doses of alpha-particles. Cancer Res. 1992;52:6394–6396. - PubMed
    1. Nagasawa H, et al. Bystander effect for chromosomal aberrations induced in wild-type and repair deficient CHO cells by low fluences of alpha particles. Mutat. Res. 2002;508:121–129. - PubMed
    1. Azzam EI, et al. Oxidative metabolism modulates signal transduction and micronucleus formation in bystander cells from alpha-particle-irradiated normal human fibroblast cultures. Cancer Res. 2002;62:5436–5442. - PubMed
    1. Prise KM, et al. What role for DNA damage and repair in the bystander response? Mutat. Res. 2006;597:1–4. - PubMed
    1. Hu B, et al. The time and spatial effects of bystander response in mammalian cells induced by low dose radiation. Carcinogenesis. 2006;27:245–251. - PubMed

Publication types

MeSH terms

LinkOut - more resources