. 2009 Oct;183(2):723-32, 1SI-7SI.
doi: 10.1534/genetics.109.104984. Epub 2009 Aug 3.

Cis-regulatory changes at FLOWERING LOCUS T mediate natural variation in flowering responses of Arabidopsis thaliana

Affiliations

Cis-regulatory changes at FLOWERING LOCUS T mediate natural variation in flowering responses of Arabidopsis thaliana

Christopher Schwartz et al. Genetics. 2009 Oct.

Abstract

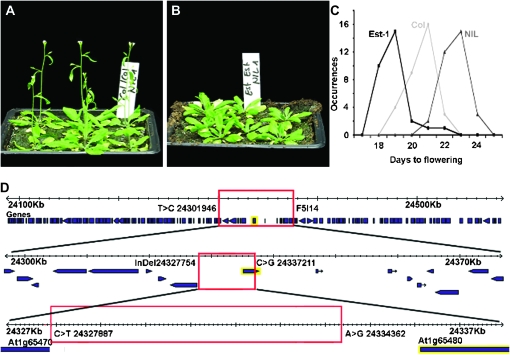
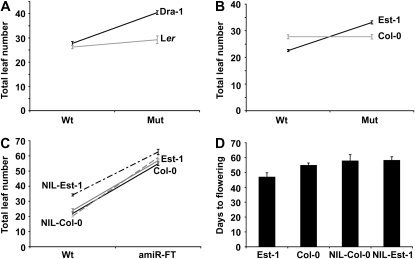
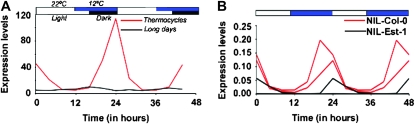
Flowering time, a critical adaptive trait, is modulated by several environmental cues. These external signals converge on a small set of genes that in turn mediate the flowering response. Mutant analysis and subsequent molecular studies have revealed that one of these integrator genes, FLOWERING LOCUS T (FT), responds to photoperiod and temperature cues, two environmental parameters that greatly influence flowering time. As the central player in the transition to flowering, the protein coding sequence of FT and its function are highly conserved across species. Using QTL mapping with a new advanced intercross-recombinant inbred line (AI-RIL) population, we show that a QTL tightly linked to FT contributes to natural variation in the flowering response to the combined effects of photoperiod and ambient temperature. Using heterogeneous inbred families (HIF) and introgression lines, we fine map the QTL to a 6.7 kb fragment in the FT promoter. We confirm by quantitative complementation that FT has differential activity in the two parental strains. Further support for FT underlying the QTL comes from a new approach, quantitative knockdown with artificial microRNAs (amiRNAs). Consistent with the causal sequence polymorphism being in the promoter, we find that the QTL affects FT expression. Taken together, these results indicate that allelic variation at pathway integrator genes such as FT can underlie phenotypic variability and that this may be achieved through cis-regulatory changes.


Figures

F<sc>igure</sc> 1.—
Figure 1.—
QTL analysis of flowering time in Est-1/Col-0 AI-RIL population. (A) Distribution of flowering time (expressed as leaf number) in the AI-RIL population grown in the greenhouse under 23° LD, including the means for the Est-1 and Col-0 parents. (B) QTL maps of flowering time (measured as days to flower) under three different growth conditions: blue, 16° LD in growth room; red, 23° LD in growth chambers; black, 23° LD in green house. The horizontal line represents the significance threshold for the LOD score. (C and D) Average flowering times of the HIFs based on the genotype of the F5I14 marker. White bars, homozygous for Col-0; gray bars, heterozygous; black bars, homozygous for Est-1. Significant differences (P < 0.0001) between the Est-1 and Col-0 genotypes are indicated by asterisks. Error bars represent standard error of mean (SEM).
F<sc>igure</sc> 2.—
Figure 2.—
Genetic interactions between flowering time QTL. (A and B) Two-dimensional genome scan in Est-1/Col-0 AI-RIL population in 23° LD (A) and 16° LD (B), with epistatic interactions on top, and additive interactions on the bottom. Interactions between markers on each chromosome are shown. Color scale indicates LOD scores for epistatic (left) and additive interactions (right). (C) QTL analyses of thermosensitivity in Est-1/Col-0 AI-RIL population, contrasting flowering at 16° and 23°, using three different 23° data sets: black, growth room 1; red, growth room 2; blue, green house. The thermosensitivity QTL colocalizes with the QTL in the F5I14/FT region (Figure 1B). (D) Distribution of flowering time in Dra-1 × Ler F2 population at 23° and 16° LD. (E) QTL analysis of flowering time in Dra-1 × Ler F2 population. (F) Two-dimensional genome scan in Dra-1 × Ler F2 population (see A and B for legend).
F<sc>igure</sc> 3.—
Figure 3.—
Fine mapping of the chromosome 1 Est-1/Col QTL. (A) Four-week-old NIL-Col. (B) NIL-Est of same age and grown in parallel. (C) Distributions of flowering time for Est-1, Col-0, and the Est-NIL. (D) Fine mapping of the QTL. Transcription units are in purple. The FT gene (At1g65480) is highlighted in yellow. The three levels reflect the progressive rounds of fine mapping, with the final 6.7-kb mapping interval in the FT promoter shown on the bottom. The flanking markers used for mapping are shown. FAS1 (At1g65470) is the gene to the left.
F<sc>igure</sc> 4.—
Figure 4.—
Genetic evidence for FT being causal for the chromosome 1 QTL. (A and B) Quantitative complementation assays. (A) Flowering time of F1 plants from crosses of Dra-1 and Ler to Col-0 (“wild type”) and the isogenic ft-10 mutant. (B) Flowering time of F1 plants from crosses of Est-1 and Col-0 to Ler (“wild type”) and the isogenic ft-1 mutant. (C) Quantitative knockdown experiment with artificial miRNA against FT (amiR-ft-1) introduced into the two NILs and the two parents. (D) Flowering time of the different genotypes under short days.
F<sc>igure</sc> 5.—
Figure 5.—
Allelic variation affects FT expression. (A) Comparison of FT expression in Col-0 under thermocycles (12 hr 22°/12 hr 12°, continuous white light) and light cycles (16 hr light/8 hr dark, constant 23°). (B) Comparison of FT expression levels in NIL-Col and NIL-Est under thermocycles. Two different lines for each NIL are shown. The second NIL-Est line had very low FT expression, and its values are barely visible.

Similar articles

Cited by

References

    1. Abe, M., Y. Kobayashi, S. Yamamoto, Y. Daimon, A. Yamaguchi et al., 2005. FD, a bZIP protein mediating signals from the floral pathway integrator FT at the shoot apex. Science 309: 1052–1056. - PubMed
    1. Ahn, J. H., D. Miller, V. J. Winter, M. J. Banfield, J. H. Lee et al., 2006. A divergent external loop confers antagonistic activity on floral regulators FT and TFL1. EMBO J. 25: 605–614. - PMC - PubMed
    1. Alonso-Blanco, C., S. E. El-Assal, G. Coupland and M. Koornneef, 1998. Analysis of natural allelic variation at flowering time loci in the Landsberg erecta and Cape Verde Islands ecotypes of Arabidopsis thaliana. Genetics 149: 749–764. - PMC - PubMed
    1. Aukerman, M. J., M. Hirschfeld, L. Wester, M. Weaver, T. Clack et al., 1997. A deletion in the PHYD gene of the Arabidopsis Wassilewskija ecotype defines a role for phytochrome D in red/far-red light sensing. Plant Cell 9: 1317–1326. - PMC - PubMed
    1. Balasubramanian, S., S. Sureshkumar, M. Agrawal, T. P. Michael, C. Wessinger et al., 2006. a The PHYTOCHROME C photoreceptor gene mediates natural variation in flowering and growth responses of Arabidopsis thaliana. Nat. Genet. 38: 711–715. - PMC - PubMed

Publication types

MeSH terms

Substances

Associated data