

Effects of acute variation of dialysate calcium concentrations on arterial stiffness and aortic pressure waveform
- PMID: 19654232
- PMCID: PMC2781154
- DOI: 10.1093/ndt/gfp351
Effects of acute variation of dialysate calcium concentrations on arterial stiffness and aortic pressure waveform
Abstract
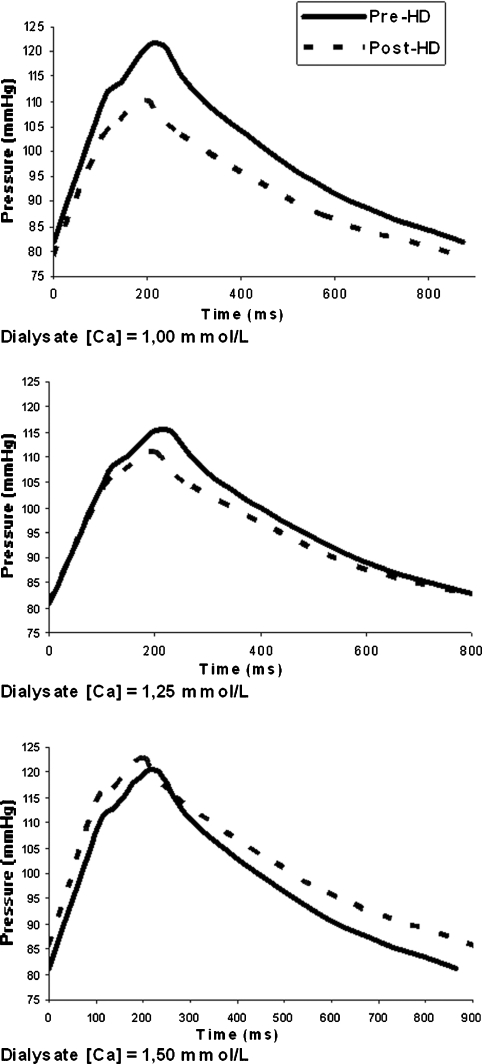
Background: Abnormal mineral metabolism in chronic kidney disease plays a critical role in vascular calcification and arterial stiffness. The impact of presently used dialysis calcium concentration (D(Ca)) on arterial stiffness and aortic pressure waveform has never been studied. The aim of the present study is to evaluate, in haemodialysis (HD) patients, the impact of acute modification of D(Ca) on arterial stiffness and central pulse wave profile (cPWP). Method. A randomized Latin square cross-over study was used to evaluate the three different concentrations of D(Ca) (1.00, 1.25 and 1.50 mmol/L) during the second HD of the week for 3 consecutive weeks. Subjects returned to their baseline D(Ca) for the following two treatments, allowing for a 7-day washout period between each experimental HD. cPWP, carotido-radial (c-r) and carotido-femoral (c-f) pulse wave velocities (PWV), plasma level of ionized calcium (iCa) and intact parathyroid hormone (PTH) were measured prior to and immediately after each experimental HD session. Data were analysed by the general linear model for repeated measures and by the general linear mixed model.
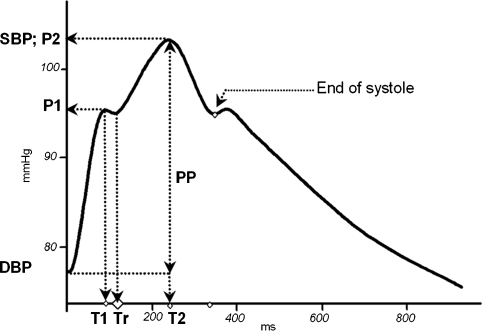
Results: Eighteen patients with a mean age of 48.9 +/- 18 years and a median duration of HD of 8.7 months (range 1-87 months) completed the study. In post-HD, iCa decreased with D(Ca) of 1.00 mmol/L (-0.14 +/- 0.04 mmol/L, P < 0.001), increased with a D(Ca) of 1.50 mmol/L (0.10 +/- 0.06 mmol/L, P < 0.001) but did not change with a D(Ca) of 1.25 mmol/L. Tests of within-subject contrast showed a linear relationship between higher D(Ca) and a higher post-HD Deltac-f PWV, Deltac-r PWV and Deltamean BP (P < 0.001, P = 0.008 and P = 0.002, respectively). Heart rate-adjusted central augmentation index (AIx) decreased significantly after HD, but was not related to D(Ca). The timing of wave refection (Tr) occurred earlier after dialysis resulting in a linear relationship between higher D(Ca) and post-HD earlier Tr (P < 0.044). In a multivariate linear-mixed model for repeated measures, the percentage increase in c-f PWV and c-r PWV was significantly associated with the increasing level of iCa, whereas the increasing level of DeltaMBP was not significant. In contrast, the percentage decrease in Tr (earlier wave reflection) was determined by higher DeltaMBP and higher ultrafiltration, whereas the relative change in AIx was inversely determined by the variation in the heart rate and directly by DeltaMBP.
Conclusion: We conclude that D(ca) and acute changes in the serum iCa concentration, even within physiological range, are associated with detectable changes of arterial stiffness and cPWP. Long-term studies are necessary to evaluate the long-term effects of D(Ca) modulation on arterial stiffness.
Figures
Similar articles
-
Impact of dialysate calcium concentration on the progression of aortic stiffness in patients on haemodialysis.Nephrol Dial Transplant. 2011 Nov;26(11):3695-701. doi: 10.1093/ndt/gfr138. Epub 2011 Mar 31. Nephrol Dial Transplant. 2011. PMID: 21459785 Clinical Trial.
-
Intradialytic and interdialytic effects of treatment with 1.25 and 1. 75 Mmol/L of calcium dialysate on arterial compliance in patients on hemodialysis.Am J Kidney Dis. 2000 Jun;35(6):1096-103. doi: 10.1016/s0272-6386(00)70046-1. Am J Kidney Dis. 2000. PMID: 10845823 Clinical Trial.
-
Diverse effects of interdialytic intervals on central wave augmentation in haemodialysis patients.Nephrol Dial Transplant. 2013 Aug;28(8):2160-9. doi: 10.1093/ndt/gft085. Epub 2013 May 3. Nephrol Dial Transplant. 2013. PMID: 23645477
-
The choice of the dialysate calcium concentration in the management of patients on haemodialysis and haemodiafiltration.Nephrol Dial Transplant. 2003 Aug;18 Suppl 7:vii37-40; discussion vii57. doi: 10.1093/ndt/gfg1077. Nephrol Dial Transplant. 2003. PMID: 12953028 Review.
-
1alpha(OH)D3 One-alpha-hydroxy-cholecalciferol--an active vitamin D analog. Clinical studies on prophylaxis and treatment of secondary hyperparathyroidism in uremic patients on chronic dialysis.Dan Med Bull. 2008 Nov;55(4):186-210. Dan Med Bull. 2008. PMID: 19232159 Review.
Cited by
-
Acute effects of cinacalcet on arterial stiffness and ventricular function in hemodialysis patients: A randomized double-blinded crossover study.Medicine (Baltimore). 2017 May;96(21):e6912. doi: 10.1097/MD.0000000000006912. Medicine (Baltimore). 2017. PMID: 28538380 Free PMC article. Clinical Trial.
-
The impact of low and high dialysate calcium concentrations on cardiovascular disease and death in patients undergoing maintenance hemodialysis: a systematic review and meta-analysis.Clin Exp Nephrol. 2024 Jun;28(6):557-570. doi: 10.1007/s10157-024-02460-3. Epub 2024 Feb 24. Clin Exp Nephrol. 2024. PMID: 38396314
-
Arterial stiffness and dialysis calcium concentration.Int J Nephrol. 2011;2011:839793. doi: 10.4061/2011/839793. Epub 2011 Apr 26. Int J Nephrol. 2011. PMID: 21603117 Free PMC article.
-
Skeletal and cardiovascular consequences of a positive calcium balance during hemodialysis.J Bras Nefrol. 2021 Oct-Dec;43(4):539-550. doi: 10.1590/2175-8239-JBN-2020-0098. J Bras Nefrol. 2021. PMID: 33107900 Free PMC article. Review.
-
Can we reverse arterial stiffness by intervening on CKD-MBD biomarkers?Clin Kidney J. 2023 May 15;16(11):1766-1775. doi: 10.1093/ckj/sfad112. eCollection 2023 Nov. Clin Kidney J. 2023. PMID: 37915898 Free PMC article. Review.
References
-
- Blacher J, Guerin AP, Pannier B, et al. Impact of aortic stiffness on survival in end-stage renal disease. Circulation. 1999;99:2434–2439. - PubMed
-
- Blacher J, Safar ME, Guerin AP, et al. Aortic pulse wave velocity index and mortality in end-stage renal disease. Kidney Int. 2003;63:1852–1860. - PubMed
-
- London GM, Marchais SJ, Guerin AP, et al. Cardiac hypertrophy and arterial alterations in end-stage renal disease: hemodynamic factors. Kidney Int Suppl. 1993;41:S42–S49. - PubMed
-
- Marchais SJ, Guerin AP, Pannier BM, et al. Wave reflections and cardiac hypertrophy in chronic uremia. Influence of body size. Hypertension. 1993;22:876–883. - PubMed
-
- London GM. The concept of ventricular/vascular coupling: functional and structural alterations of the heart and arterial vessels go in parallel. Nephrol Dial Transplant. 1998;13:250–253. - PubMed
Publication types
MeSH terms
Substances
Grants and funding
LinkOut - more resources
Full Text Sources
Miscellaneous
